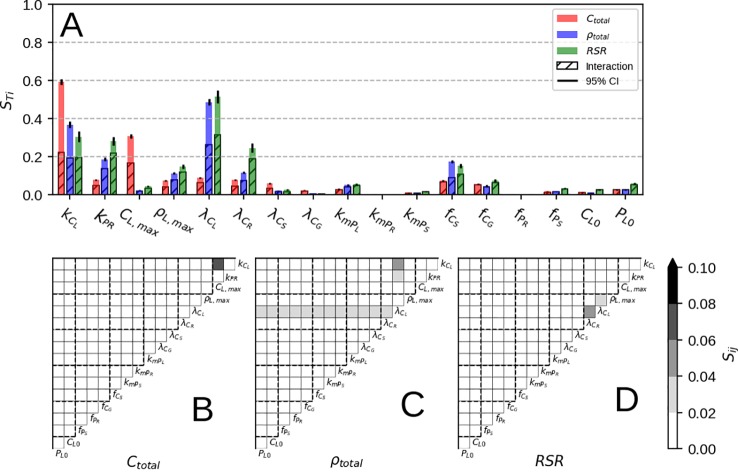
Figure 4.
Results of Sobol sensitivity analysis on Ctotal, ρtotal and RSR at simulation end. Panel (A) shows the total contribution and the sum of all interactions for each model parameter, where as panels (B–D) show individual interactions. Parameter description can be found in Table 2 .

