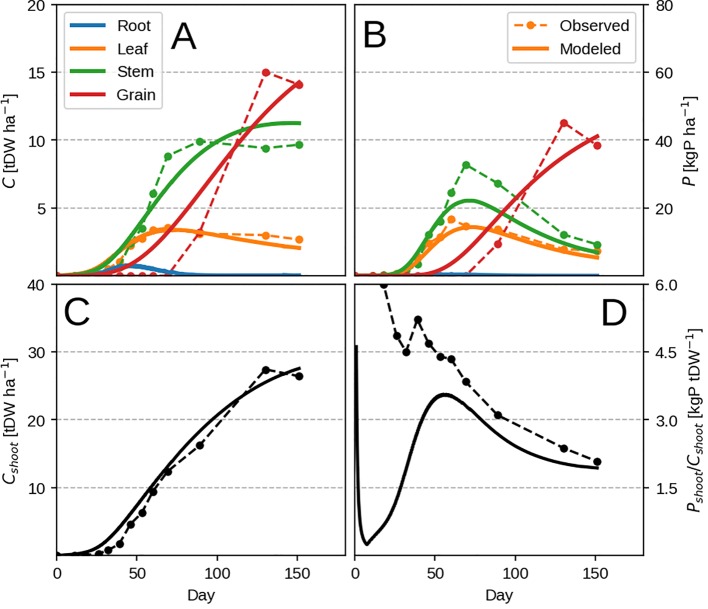
Figure 5.
Modeled vs. observed time-series for the highest P input field maize experiment (block 4). Panels (A, B) show organ biomass and organ P, where as C, D show the same but summed across all shoot organs. Individual organs are depicted with different colors, where as total plant quantities are depicted with black.

