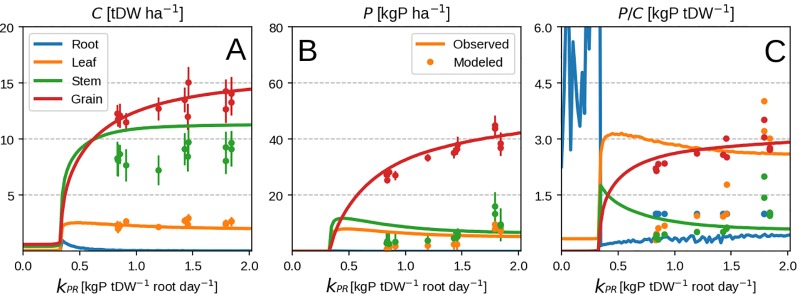
Figure 6.
Modeled vs. observed values at field maize experiment season end as function of root P uptake rate. Leaf P remobilisation is turned on in the top row and turned off in the bottom one. From left to right the columns show C pool, P pool and concentration for leaf, stem and grain. Panels (A-C) correspond to organ biomass, organ P and organ P concentration respectively. Different organs are depicted with different colors. Lines are modeled values and markers are observed ones. Panels (A–C) correspond to organ biomass, organ P and organ P concentration respectively.

