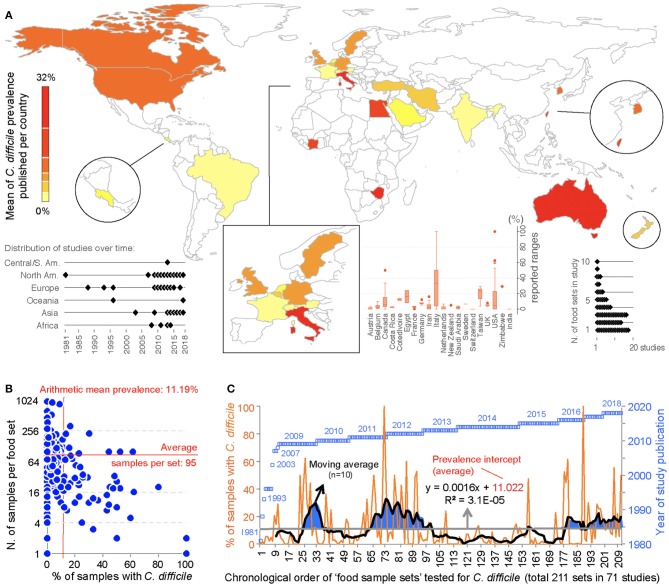
Figure 3.
Global distribution and temporal oscillations of the reported prevalence of C. difficile in the human diet. (A) Map of distribution of studies included in the meta-analysis (n = 79) with mean prevalence per country. Insets, Example of prevalence variability among food items tested per country, distribution of studies over time, and number of food item categories (e.g., beef, vegetables, poultry) tested per study. (B) Scatterplot (correlation) of number of food samples processed (sample size, n=) for each food set sample and the percentage of samples with C. difficile. (C) Chronological order of reported proportions for various food samples tested as sets irrespective of food category (food sample sets, n = 232). Note that some studies collected samples from >1 food item category for culture of C. difficile. The plot illustrates initial 71 studies.

