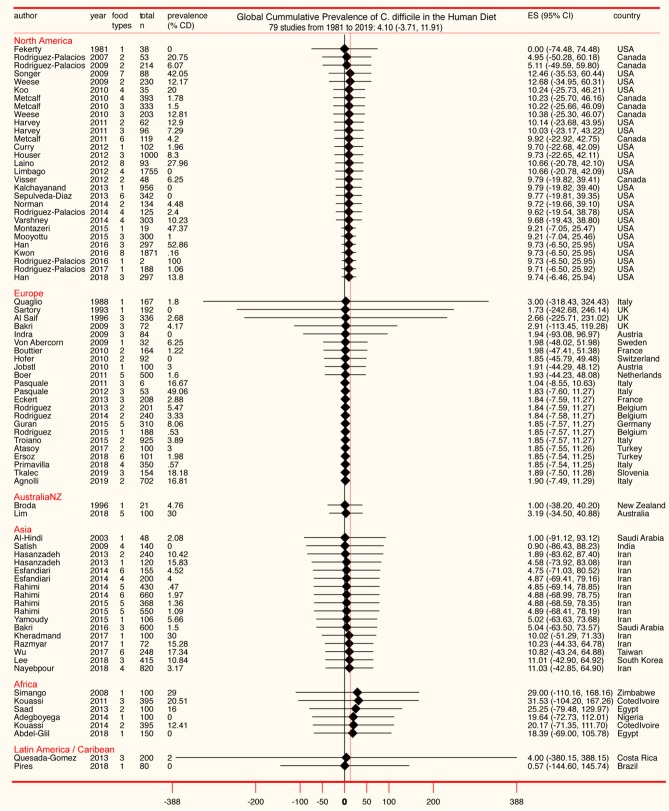
Figure 5.
Forest plot of cumulative prevalence of C. difficile in foods for studies published since 1981, in chronological order per region (“study-level,” n = 79). Notice heterogeneity across regions. The detailed decomposed heterogeneity at the “food-item-category” level (food types), for 232 food sets is presented below.

