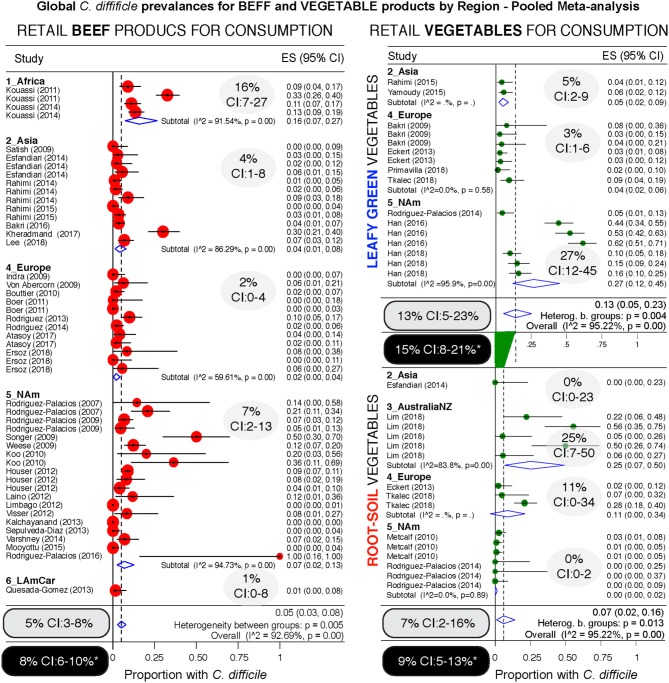
Figure 9.
Comparative global and regional prevalence of C. difficile in beef and vegetables. Forest plots using the Arcsine Transformation of the raw data force the inclusion of adjusted data derived from “zero” prevalence studies. Confidence intervals (CI) are exact binomial. Rectangular ovals denote overall estimates. Shaded ovals, region estimates. Back ovals denote overall estimates from unadjusted meta-analysis (detailed plots with higher prevalence estimates from unadjusted data to include only CD positive studies are in Supplementary Figures 3, 4). Note larger variability among studies conducted with vegetables (wide overall CIs) when compared to variability for beef products (narrow overall CI). Leafy green vegetables are twice more commonly found to contain CD compared to root vegetables. Analysis of these three food type categories, based on weighed mean prevalences, ranks leafy green vegetables as more likely to carry CD, and beef products the least likely.

