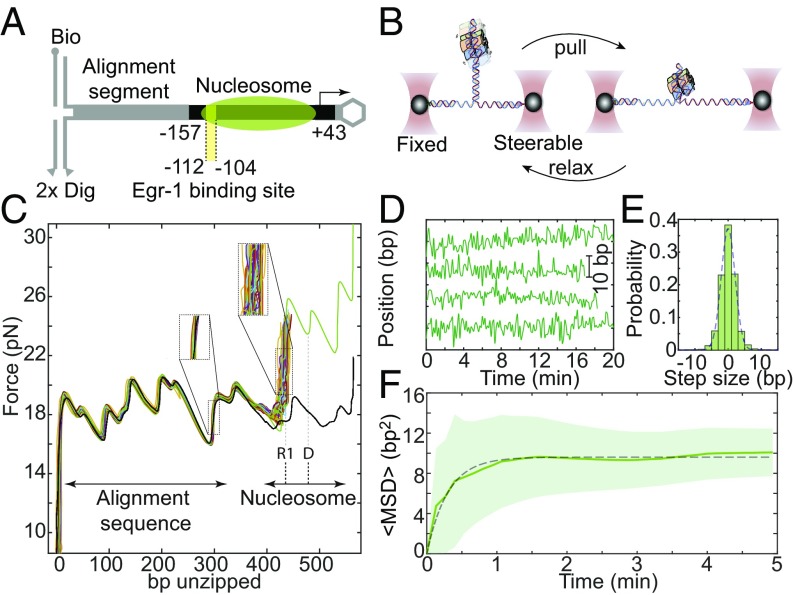
Fig. 1.
Real-time measurements of the base pair-scale diffusion of nucleosomes. (A) Nucleosomes reconstituted on the –157/+43 Lhb sequence are ligated to an alignment segment and connected to dsDNA handles. (B) The construct is attached to polystyrene beads trapped in two separate optical traps. One of the traps is moved to unzip the tethered construct until a force of ∼23–24 pN is reached, indicating the presence of the nucleosome, and then relaxed. This process is repeated with a total cycle time of 8 s. (C) Repetitive partial unzipping cycles of a nucleosome reconstituted on the Lhb TSS sequence (colored). The last cycle is used to dissociate the nucleosome irreversibly (green) and is followed by an additional cycle of unzipping of the resulting naked DNA (black). Note the broader distribution of nucleosome’s position (Right Inset) relative to the distribution of the position of an alignment segment (Left Inset). The position of region 1 (R1) and the dyad (D) are indicated. (D) Individual traces of the position of nucleosomes as a function of time, sampled every 8 s. (E) Probability distribution function of the step size, i.e., the relative position of the nucleosome between times separated by five unzipping cycles. Data filtered with a five cycles running average window. A Gaussian fit to the histogram is shown (dashed line). The skewness of the distribution is <0.1. (F) Ensemble-averaged mean squared displacement (MSD) for nucleosomes reconstituted on Lhb TSS, as a function of time. Data shown as mean ± SEM, low-pass filtered with a five-points window running average. The number of experiments is shown in SI Appendix, Table S3. The dashed line is a fit to the expression , with a diffusion constant D = 1.3 ± 0.14 bp2⋅s−1 and confining potential spring constant k = 1.2 ± 0.2 pN⋅bp−1.

