Fig. 2.
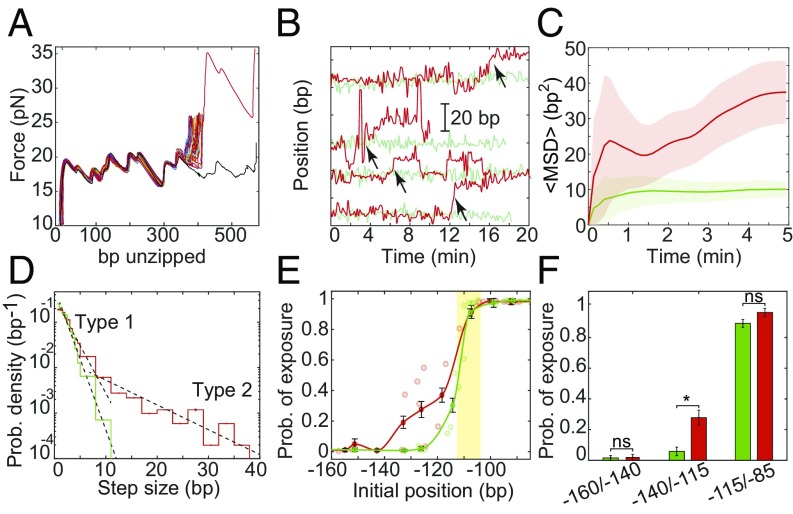
H2A.Z increases the diffusion of nucleosomes. (A) Repetitive partial unzipping curves of a nucleosome reconstituted with H2A.Z. Data are presented as in Fig. 1C. (B) Position of individual H2A (green) and H2A.Z (red) nucleosomes over time, presented as in Fig. 1D. The H2A traces (green) are identical to those in Fig. 1D. Examples of repositioning events larger than 5 bp (“type 2”) are marked with arrows. (C) Ensemble-averaged MSD of nucleosomes as a function of time, presented as in Fig. 1F. The number of experiments is shown in SI Appendix, Table S3. (D) Probability distribution function of the step size. Single-exponential fits (dashed black lines) are shown for steps sizes <5 bp (“type 1”) and >5 bp (“type 2”). nsteps, H2A = 2,274 and nsteps, H2A.Z = 1,308. (E) Probability of exposure of the Egr-1 binding site (yellow strip), calculated for experiments longer than 7 min (i.e., the number of nucleosome’s positions whose 5′ edge is positioned downstream the Egr-1 binding site, out of the total number of positions in the same experiment); nH2A = 75 and nH2A.Z = 88; mean ± SEM. (F) The average probability of exposure for nucleosomes whose initial 5′ edge is located between −160/−140 (nH2A = 3; nH2A.Z = 3), −140/−115 (nH2A = 5; nH2A.Z = 6), and −115/−85 (nH2A = 12; nH2A.Z = 4) is shown; mean ± SEM; *P < 0.05, Student’s t test.

