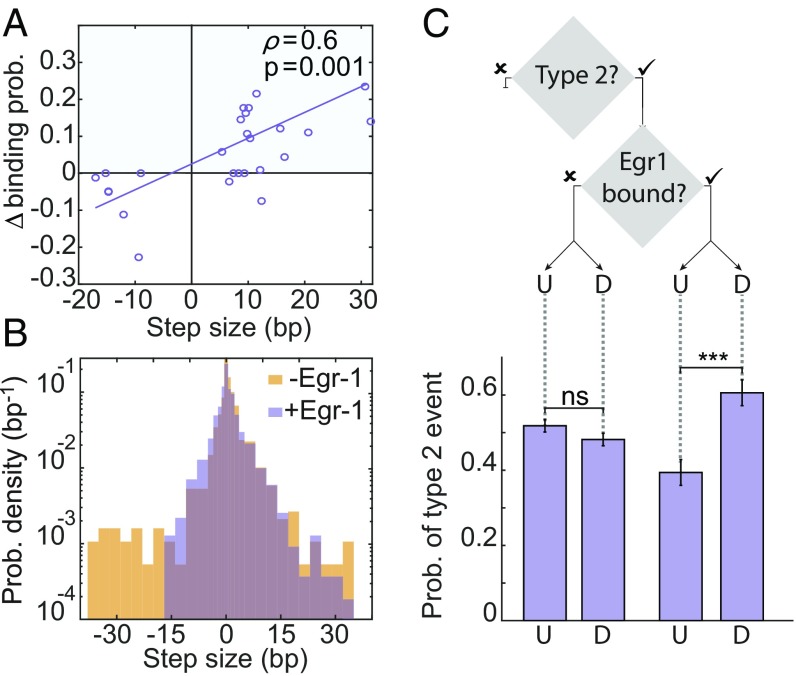
Fig. 4.
Binding of a TF biases the diffusion of the nucleosome. (A) Two-dimensional scattering plot for the change in binding probability vs. the size of a type 2 repositioning step, for H2A.Z-containing nucleosomes. Positive changes (blue area) correspond to an increase in the binding probability, while negative changes (white area) to a decrease (nH2A = 6; nH2A.Z = 27). A linear fit to the scatter plot data are shown; Pearson correlation ρ = 0.6, P = 0.01. (B) Probability distribution function of the step size for the experiments with H2A.Z-containing nucleosomes, with initial position between −140/−115, in the absence (yellow; nsteps = 1,308) or the presence (purple; nsteps = 2,916) of Egr-1. (C) Conditional probability for upstream (U) or downstream (D) type 2 events, given that Egr-1 is bound (Right) or not (Left) to its binding site. ntype 2 = 974, nupstream,bound = 56, ndownstream,bound = 84, nupstream, not bound = 429, and ndownstream, not bound = 405. ***P < 0.001, χ2 test.

