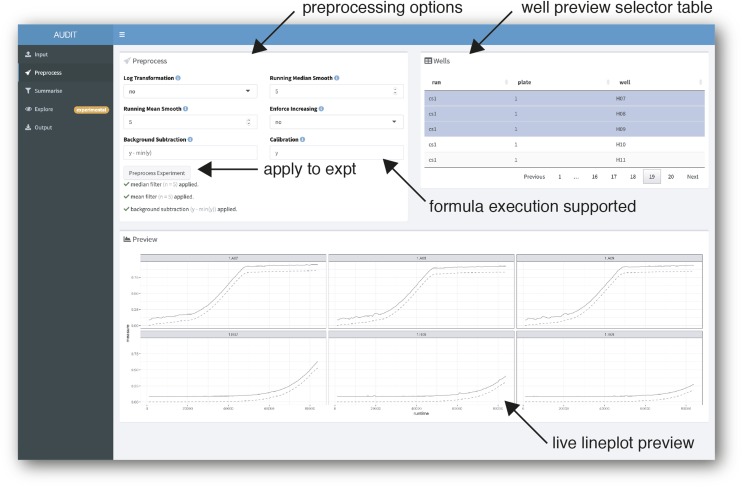
Figure 4.
Live preview and flexible specification of varied preprocessing methods. Screenshot of preprocess panel. AUDIT makes six independent preprocessing options available (arrow, top-left). The Background Subtraction and Calibration input fields support arbitrary formula (code) execution (arrow, middle-right). The well preview selector table (arrow, top-right) contains data from selected runs in the experiment. When clicked, the ‘Preprocess Experiment’ button applies the preprocessing to the whole experiment (arrow, middle-left). To display a live plot preview, users select rows in the table. Then, AUDIT plots each well’s raw (solid line) and preprocessed measures (dashed line) (arrow, bottom-right).

