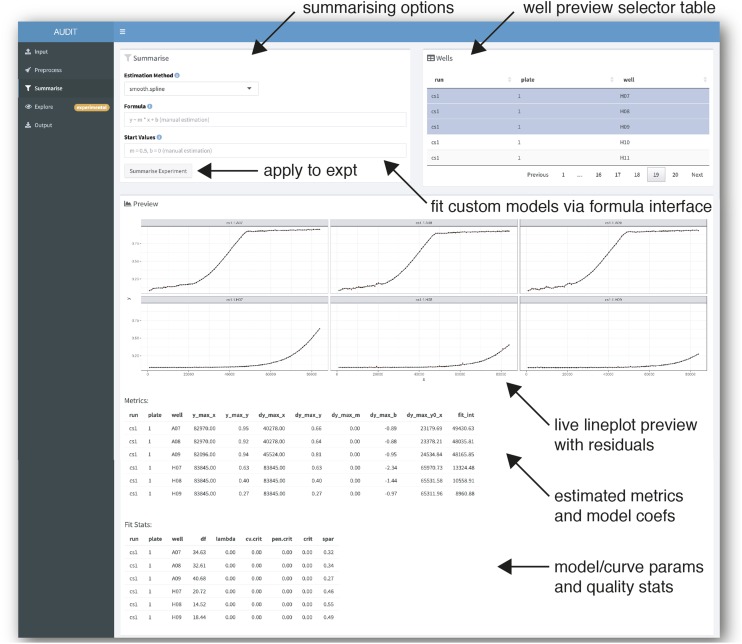
Figure 5.
Summarize growth curves by curve fit and group wells into reference and target sets. Screenshot of summarize panel in manual mode. AUDIT enables interactive specification of arbitrary growth models. Users specify a model via R’s formula interface. AUDIT estimates model coefficients for each curve, using non-linear least-squares optimization, from user-supplied initial estimates. When clicked, the ‘Summarize Experiment’ button applies the preprocessing to the whole experiment (arrow, middle-left). The well preview selector table (arrow, top-right) contains data from selected runs in the experiment. Selecting rows in the table, will cause a live line plot preview of each curve fit (solid line) atop the underlying measures data (points). Fit residual error is also plotted (red area segment). The application displays a tabular preview of the estimated summary metrics, including model specific coefficients, and the curve quality metrics.

