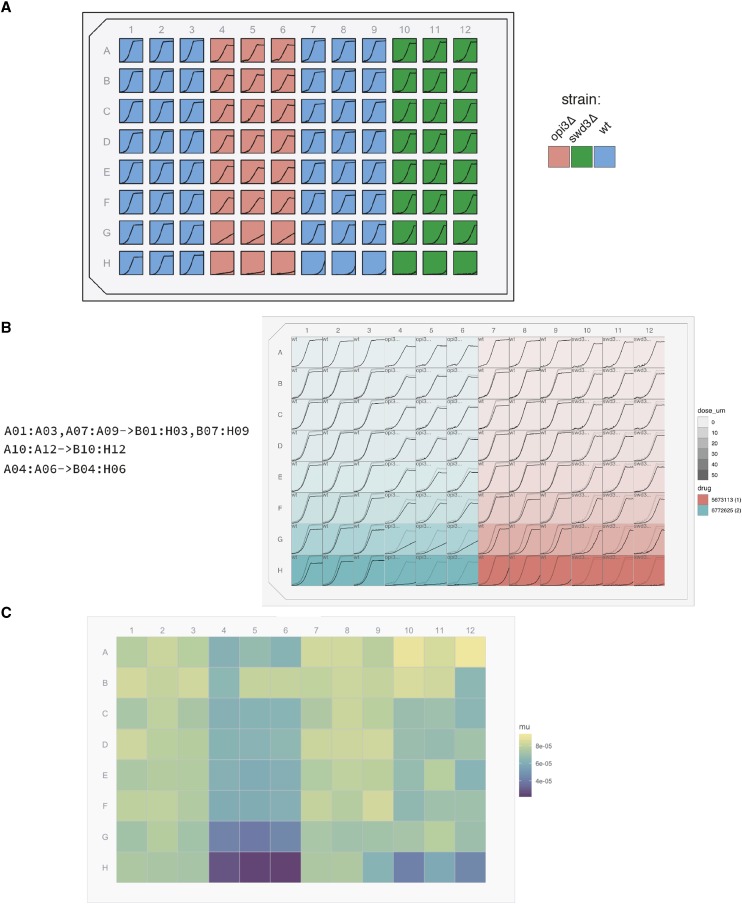
Figure 8.
Case Study Overview. A. MTP view plot maps the values of the strain variable provided in the experimental design to the well fill color. A line plot of the measures data are plotted for each well. B. MTP view plot maps the drug identifier to the fill color and the dose in micromolar to the opacity of the rectangular wells. Line plots are according to the group specifications provided to the left of the plot. For each group, each reference curve is plotted in light, semi-transparent gray, in the target well while each the data for each target well is plotted in black. C. MTP view plot maps the values of the maximum growth rate reported in the summary metrics data. Key is provided on the right for each figure panel.

