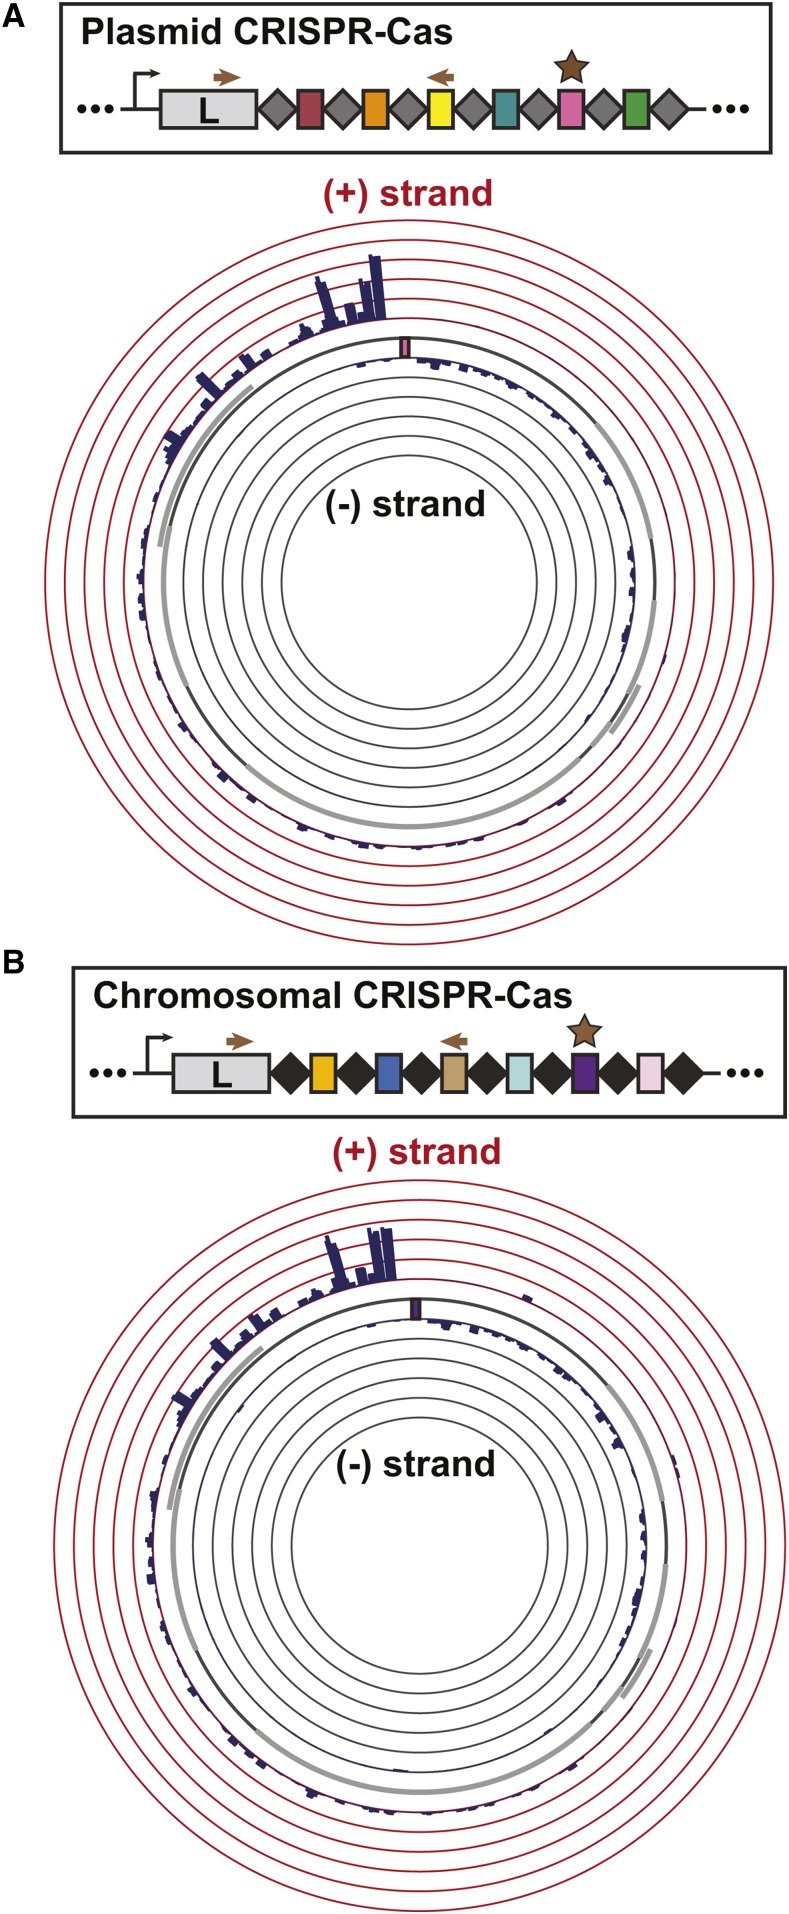
Figure 5.
Characterization of self-primed spacer acquisition in the two Lens CRISPR-Cas systems. Bacterial transformants with targeted plasmids were passaged for 20 generations without antibiotic selection to enrich for spacer acquisition; the leader end of the CRISPR array was amplified and the amplicons were Illumina sequenced. Newly targeted protospacers were obtained from the raw reads using an in-house bioinformatics pipeline and visualized with Circos. The arrows in the simplified array schematic show the primer location for PCR amplification prior to sequencing, while the star denotes the priming spacer. The priming protospacer sequence is indicated by a colored box in the Circos plot. All data are the average of three biological replicates. A) The distribution of newly targeted protospacers mapped to the priming plasmid on the Circos plot reveals a strand bias in self-primed spacer acquisition within the Lens (pLPL) CRISPR-Cas system. The height of the bars indicates the number of spacers mapped to the position on the plasmid, up to 5% of total acquired spacers. B) The distribution of newly targeted protospacers mapped to the priming plasmid shows a similar pattern of self-primed spacer acquisition within the Lens (chromosome) CRISPR-Cas system to that of its pLPL CRISPR-Cas counterpart. Labeling as in (A).

