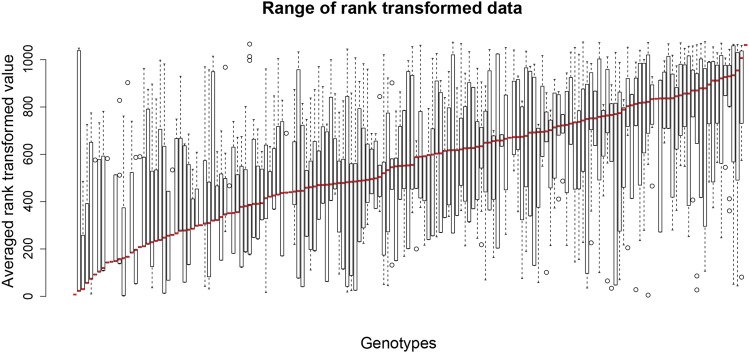
Figure 4.
Genome Wide Association. (A) Phenotype plot in rank order. Boxplots illustrating the range of rank transformed re-mating (y-axis) for each strain (x-axis). Boxplots show quartiles via box and whiskers, and median with the bold black line. Outliers are single points outside of whiskers. Genotypes with percent re-mating and rank order are available in Table S7.

