Figure 2.
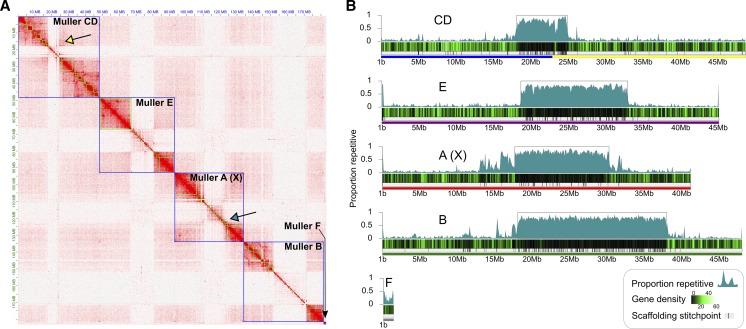
Chromosome-level genome assembly of Drosophila bifasciata using Hi-C. A) Hi-C heatmap showing long-range contacts and scaffolding of the genome assembly. Green and blue squares denote contigs and chromosomes, respectively. Euchromatic chromosome arms and heterochromatic pericentromeres for each chromosome show distinct and primarily isolated associations that resemble a ‘checkerboard’ pattern. Note that chromosome arms on opposite sides of a pericentromere often show associations on the diagonal confirming their placement (yellow arrow) while pericentromeres show finer-scale associations with their chromosome arms (blue arrow). B) Shown is the D. bifasciata genome assembled into Muller elements (color coded as in Figure 1), scaffolding stitch points, gene density (genes per 100 kb) and repeat content (proportion of bases repeat-masked in 100 kb non-overlapping windows). Boxes around highly repetitive regions indicate putative pericentromere boundaries (defined as ≥40% repeat-masked sequence in sliding windows away from the center).

