Figure 1.
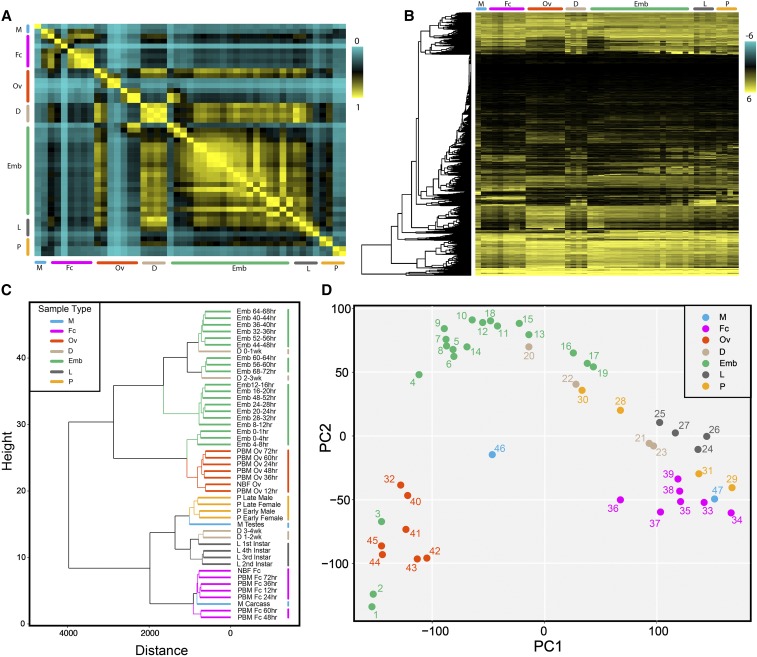
Global dynamics of gene expression. (A) Correlation matrix of all RNA seq timepoints for all known Ae. albopictus genes. (B) Hierarchical clustering heat map of albopictus genes across all developmental stages. FPKM values were log2(x+1) transformed and were scaled to plot the z-scores. (C) Dendrogram of Ae. albopictus samples clustering similar life stages closer together. Plot depicts the close relationship between all developmental samples. (D) PCA clustering of Ae. albopictus samples depicts clustering of life stages who show close similarity. PCA plot is in agreement with clustering dendrogram. Each point is labeled with the “Order” number they are assigned to from Table S1. For A-D, the second testes replicate was not shown. For A-D, the major developmental groups are indicated by color bars and are organized as follows: M (blue, male testes, male carcass), Fc (pink, NBF carcass, and multiple timepoints PBM: 12hr, 24hr, 36hr, 48hr, 60hr, and 72hr), Ov (orange, NBF ovaries, and multiple ovarian timepoints PBM: 12hr, 24hr, 36hr, 48hr, 60hr, and 72hr), D (tan, diapause at multiple timepoints: 0-1wk, 1-2wk, 2-3wk, and 3-4wk), Emb (embryo at multiple timepoints: 0-1 hr, 0-2 hr, 2-4 hr, 4-8 hr, 8-12 hr, 12-16 hr, 16-20 hr, 20-24 hr, 24-28 hr, 28-32 hr, 32-36 hr, 36-40 hr, 40-44 hr, 44-48 hr, 48-52 hr, 52-56 hr, 56-60 hr, 60-64 hr, 64-68 hr, and 68-72 hr embryos), L (gray, larvae 1st, 2nd, 3rd, and 4th instar larvae stages), and P (yellow, pupae, early male and female, and late male and female pupae stages).

