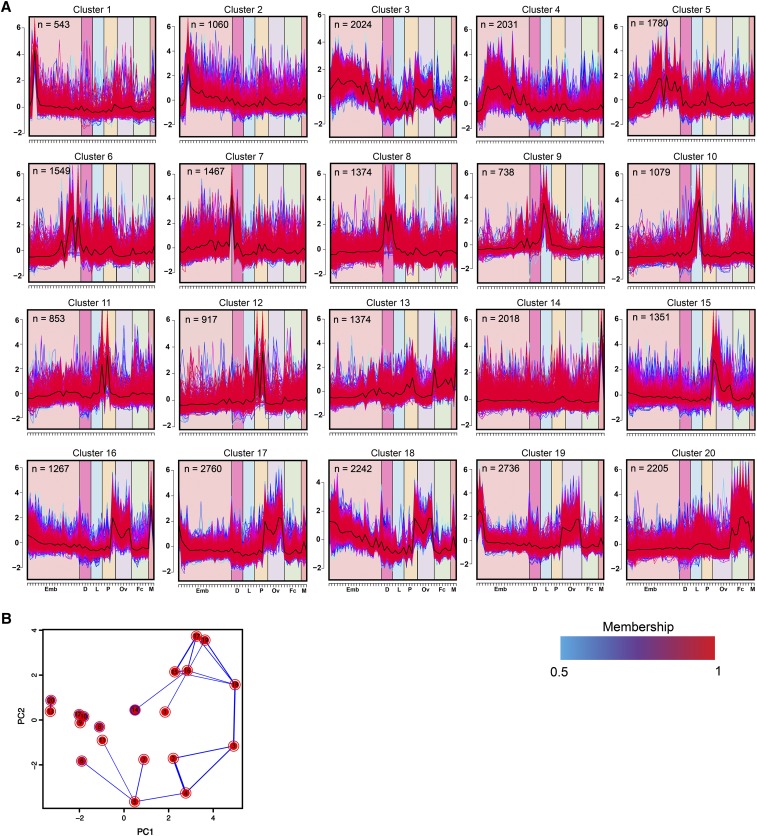
Figure 2.
Soft clustering and principal component analysis on Ae. albopictus genes. (A) Twenty albopictus gene expression profile clusters were identified through soft clustering. Each gene is assigned a line color corresponding to its membership value, with red (1) indicating high association. The developmental groups are indicated by symbols on the x-axis. (B) Principal component analysis shows relationships between the 20 clusters, with thickness of the blue lines between any two clusters reflecting the fraction of genes that are shared. N, the number of genes in each cluster.

