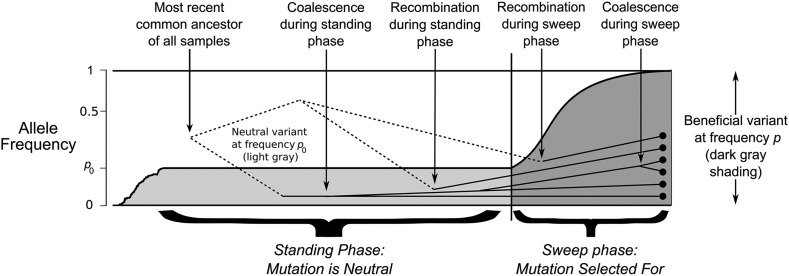
Figure 1.
A schematic of the model. The history of the derived variant is separated into two phases; the ‘standing phase’ (shown in light gray), and the ‘sweep phase’ (shown in dark gray). Axis on the left-hand side show allele frequency on a log-scale. Dots on the right-hand side represent a sample of haplotypes taken at the present day, with lines representing their genetic histories. Solid lines represent coalescent histories for the derived genetic background; dotted lines represent coalescent histories for the ancestral, neutral background. Note the allele trajectory is an idealised version as assumed in the model.

