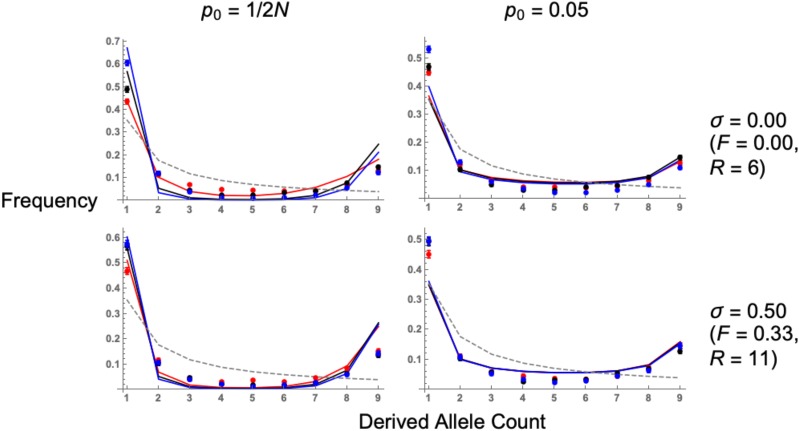
Figure 5.
Expected site frequency spectrum, in flanking regions to the adaptive mutation, following a selective sweep. Lines are analytical solutions (Equation A12 in Supplementary File S2), points are simulation results. , , , and dominance coefficient (red lines, points), 0.5 (black lines, points), or 0.9 (blue lines, points). The neutral SFS is also included for comparisons (gray dashed line). Values of , self-fertilization rates σ and recombination distances R are shown for the relevant row and column. Results for other recombination distances are in Section E of Supplementary File S1.

