Figure 4.

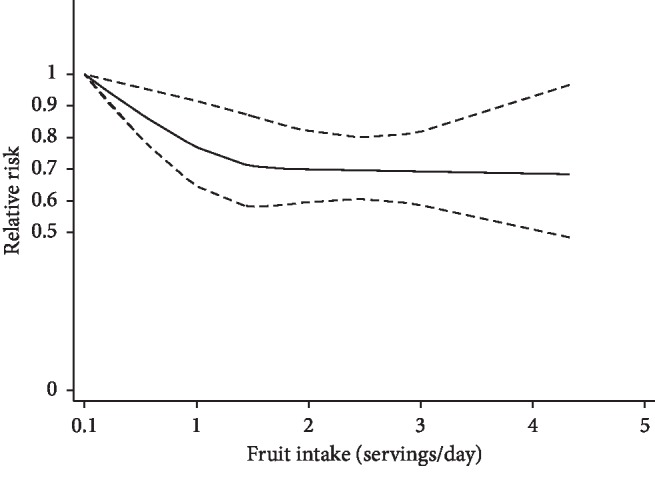
The dose-response analysis of fruit intake and the risk of COPD. The solid line and the long dashed line represent the estimated relative risks and their 95% CIs. The short dashed line represents the linear relationship.

The dose-response analysis of fruit intake and the risk of COPD. The solid line and the long dashed line represent the estimated relative risks and their 95% CIs. The short dashed line represents the linear relationship.