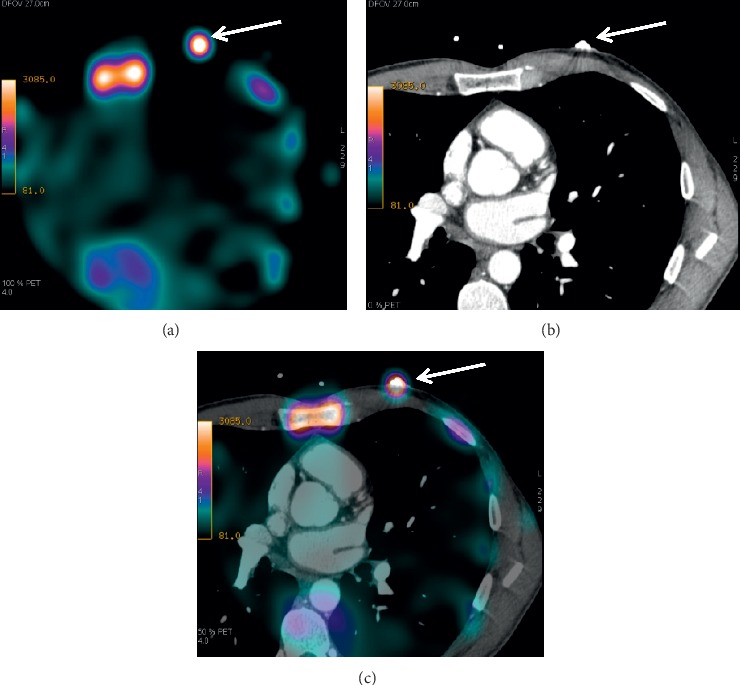
Figure 1.

An example of a fusion of the scintigraphic and CT images based on the use of surface markings. (a) Scintigraphic image (axial slice) where arrow shows a position of the radioactive marking; (b) CT tomographic image (axial slice) where arrow shows a position of the radiopaque marking; (c) SPECT/CT image where arrow shows a superposition of two markings.
