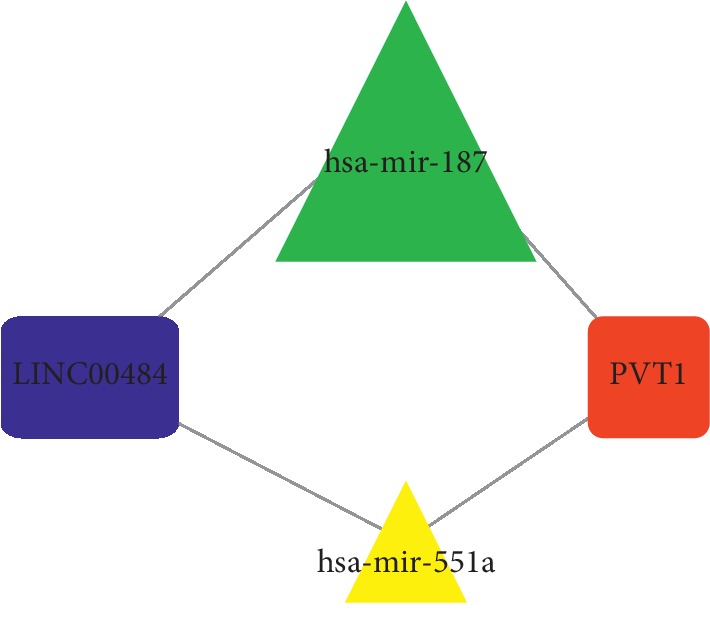
Figure 3.

Densely connected region of ceRNA network. The red rectangle indicates increased expression of lncRNA, blue rectangle indicates decreased expression of lncRNA, green triangle represents downregulated miRNA, and yellow triangle represents upregulated miRNA.
