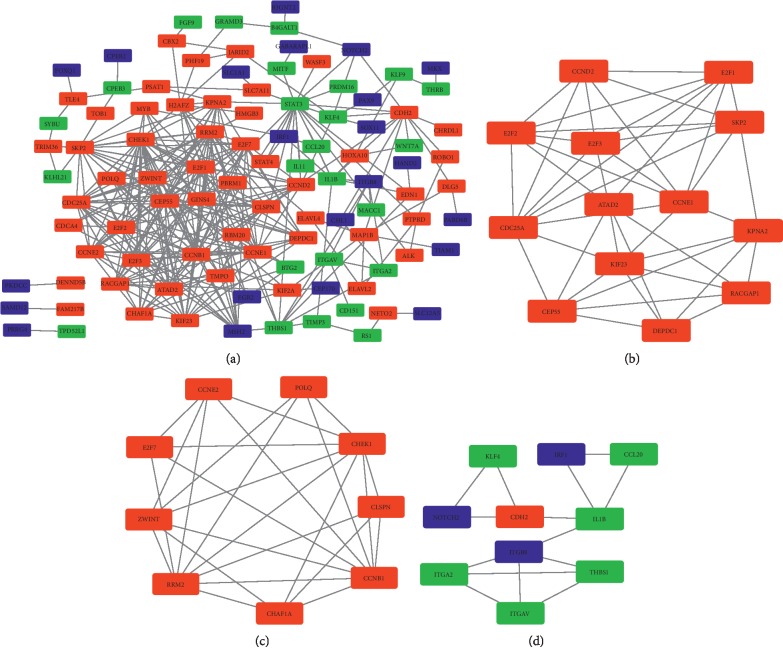
Figure 5.
Protein-protein interaction network of target genes in the ceRNA network. (a) PPI network in WT. The red rectangles represent upregulated DEMs, green rectangle represent downregulated DEMs, and blue rectangles represent DEMs that are not in the ceRNA but are associated with the target genes. (b–d) Densely connected regions of the PPI network. The red rectangles represent upregulated DEMs, green rectangle represent downregulated DEMs, and blue rectangles represent DEMs that are not in the ceRNA but are associated with the target genes.

