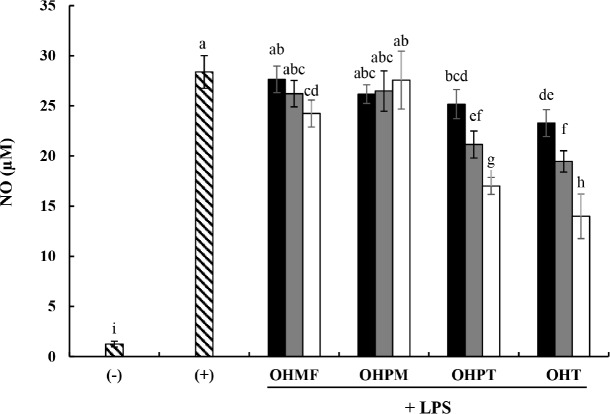
Fig. 4. Inhibitory effects of OVA hydrolysates on nitric oxide production in LPS-stimulated RAW 264.7 cells.
■: 0.5 mg/mL, ▢: 1 mg/mL, □: 2 mg/mL. All values represent the mean±SD of triplicate experiments. Bars labeled with different letters represent statistically significant differences. (–): distilled water, (+): LPS 100 ng/mL, OVA, ovalbumin; OHMF, hydrolysates treated with Multifect 14L; OHPM, hydrolysates treated with Promod 278P; OHPT, hydrolysates treated with Protex 6L; OHT, hydrolysates treated with trypsin; LPS, lipopolysaccharide.

