
Figure 4. The SSNs in Figure 2 colored using the unique colors assigned to the clusters/UniProt IDs in SSN240 (“isofunctional” SSN).
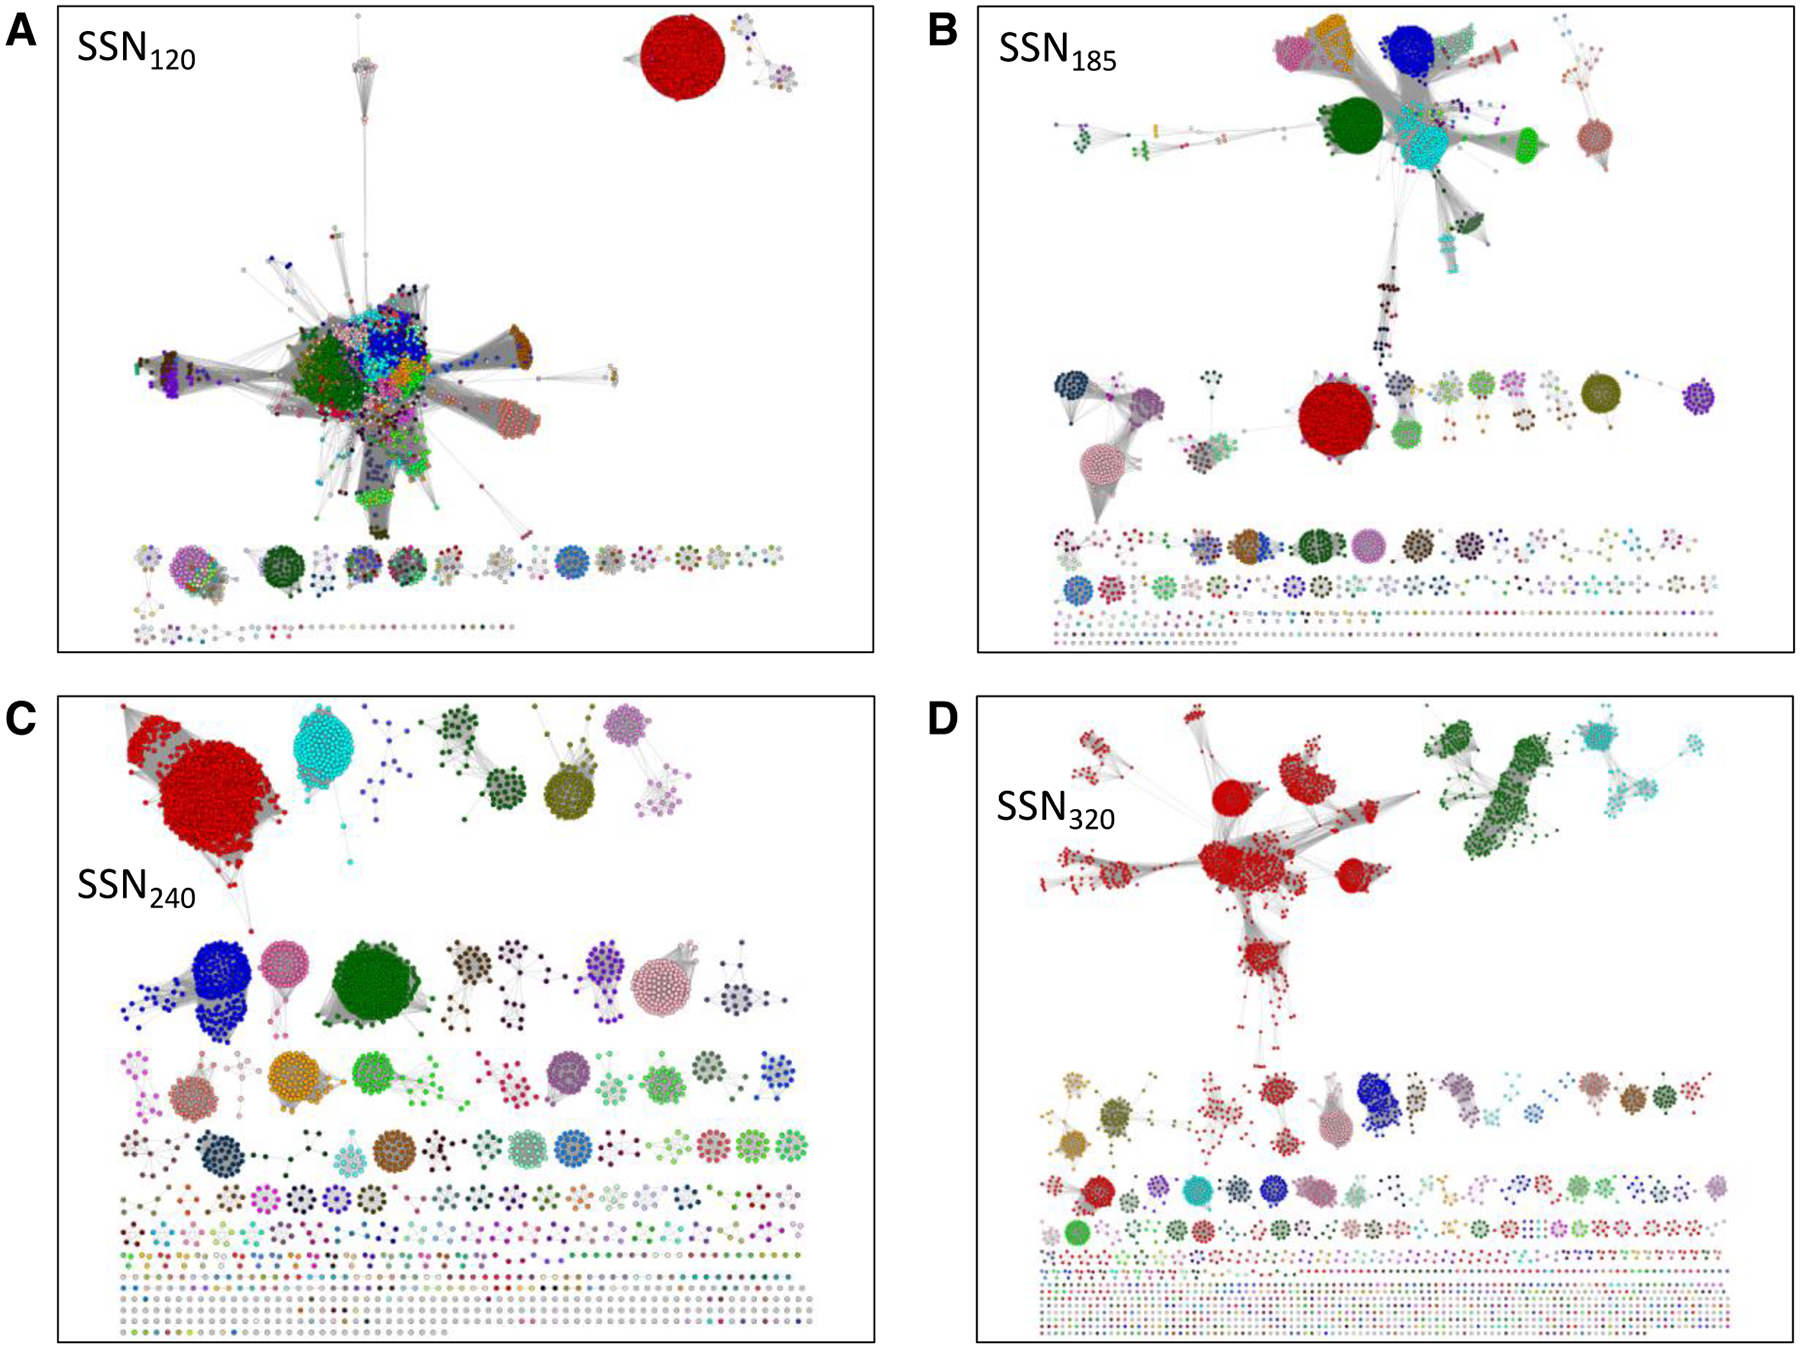
The coloring of SSN120 (Panel A), SSN185 (Panel B), and SSN320 (Panel D) was accomplished using the BridgeDB Cytoscape app and the “UniProt ID-Color-Cluster Number” mapping table provided by the Color SSN utility for SSN240 (Panel C); this table associates each accession ID in the SSN with its cluster color and number. The color mapping allows easy determination of the origins/destinations of nodes when the alignment score is changed. For example, in SSN185 the clusters in SSN185 that share dehydratase functions but are segregated in SSN240 can be determined; also, in SSN320, the clusters that result from phylogenetic separation can be determined, e.g., from the red PFL cluster in SSN240.