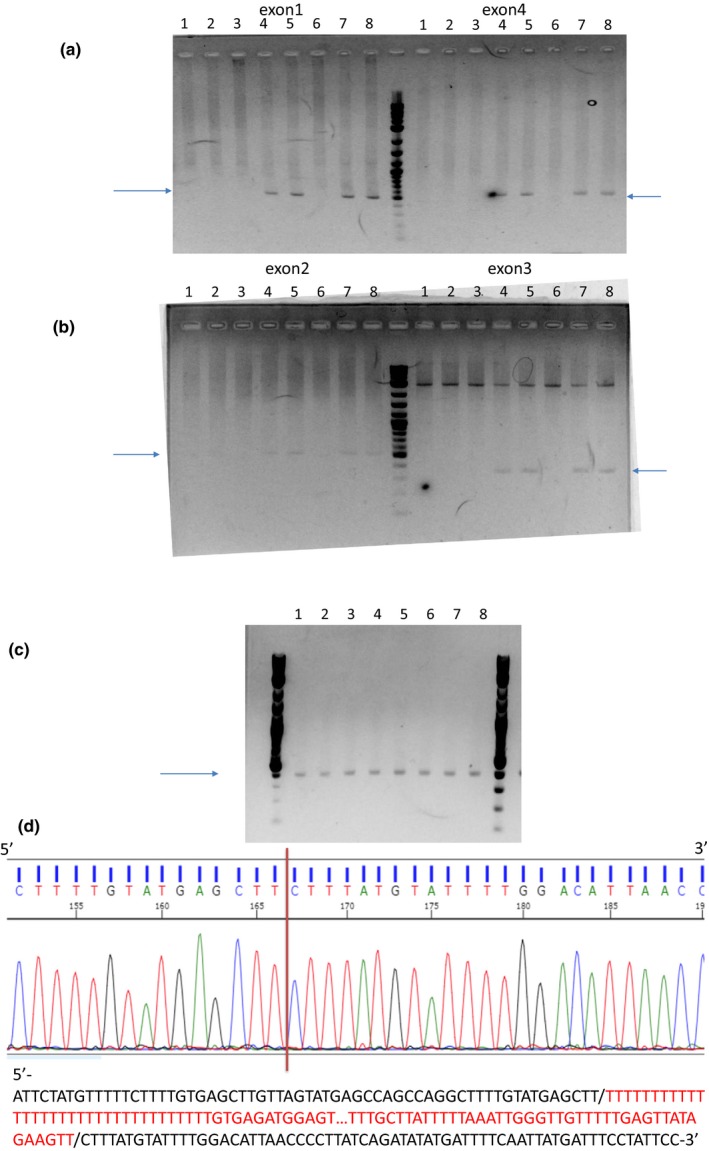
Figure 2.

The results of PCR to amplify exons 1 and 4 (a) and exons 2 and 3 (b) are shown. Four sets of PCR primers specific for exons 1, 2, 3, and 4 were used, respectively. Bands with the expected sizes were observed only in the parents, but not in the four probands. Lanes 1–5: III‐1, III‐2, III‐3, II‐3, and II‐5 of Family 1. Lanes 6–8; III‐1, II‐1, and II‐2 of Family 2. The results of PCR to amplify the region including the whole deleted length (exons 1–4) (c). Bands with the expected sizes were observed in all subjects examined (c). Lanes 1–5: III‐1, III‐2, III‐3, II‐3, and II‐5 of Family 1. Lanes 6–8; III‐1, II‐1, and II‐2 of Family 2 (c). Sanger sequencing of the PCR products revealed a 27,748‐bp deletion with the breakpoints shown with a vertical red bar (d). The deleted sequences are shown in red below
