
Figure 2.
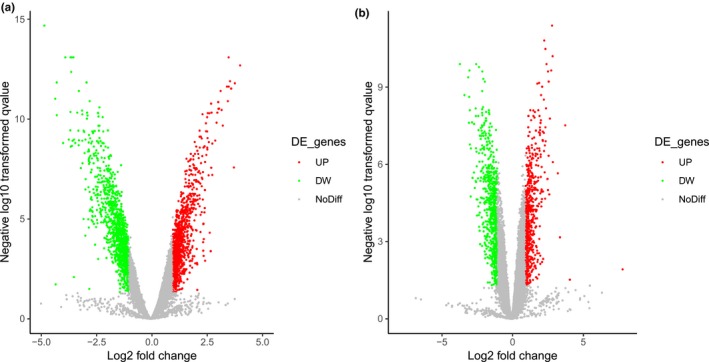
Volcano plot of the DEGs. (a) Volcano plot for the DEGs in small cell lung carcinoma, as compared with normal lung samples. (b) Volcano plot for the DEGs in large cell neuroendocrine carcinoma of the lung, as compared with normal lung samples. The x‐axis demonstrates the log 2 fold change, and the y‐axis demonstrates the log10 (adjusted p‐value). The red dots indicate up‐regulated genes, and the green dots indicate down‐regulated genes. The DEGs were filtered on the basis of a |log 2 fold change|> 1.0 and an adjusted p‐value of < .05. The grey dots represent genes with no significant difference. DEGs, differentially expressed genes