
Figure 8.
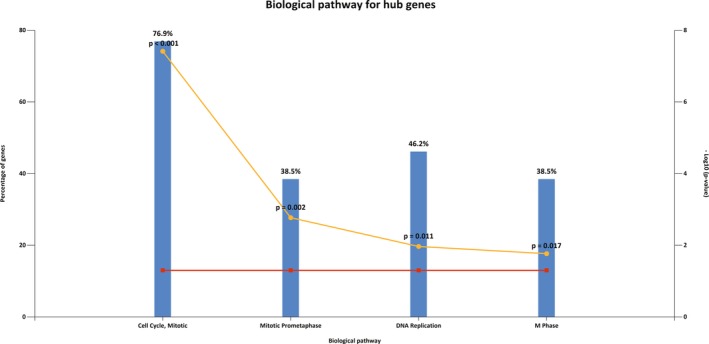
Re‐analysis of 16 hub genes by biological pathway enrichment. X axis represents significant biological pathway terms; Y axis represents percentage of genes or –log10 (p‐value)
Official websites use .gov
A
.gov website belongs to an official
government organization in the United States.
Secure .gov websites use HTTPS
A lock (
) or https:// means you've safely
connected to the .gov website. Share sensitive
information only on official, secure websites.
Re‐analysis of 16 hub genes by biological pathway enrichment. X axis represents significant biological pathway terms; Y axis represents percentage of genes or –log10 (p‐value)