Figure 2.

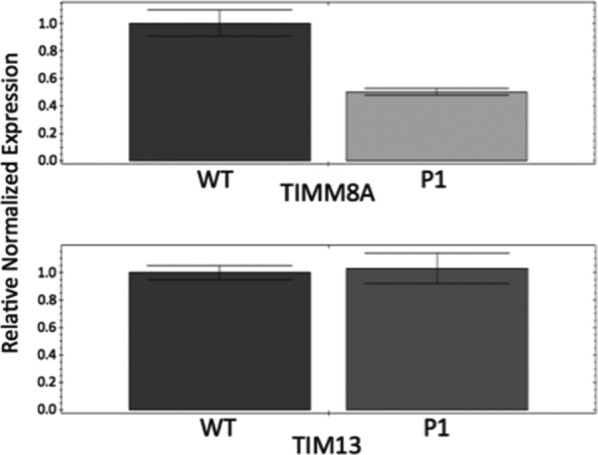
Quantitative PCR analysis of TIMM8A and TIM13 transcript abundance in WT and P1 fibroblasts, normalized to RPL4 transcript abundance. Data represent the average of three independent analyses

Quantitative PCR analysis of TIMM8A and TIM13 transcript abundance in WT and P1 fibroblasts, normalized to RPL4 transcript abundance. Data represent the average of three independent analyses