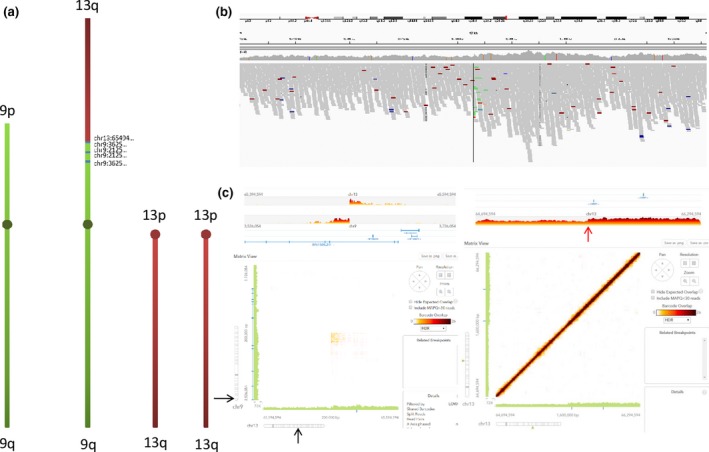
Figure 2.

Patient 2: SV representation and results from the linked‐read strategy. (A). The derivative chromosome from t(9;13) is represented here, with the normal chromosomes of patient 2. The distal region of the short arm of the chromosome 9 is deleted, and a 900 Kb region of the chromosome 9 in the vicinity of the breakpoint is duplicated. The distal part of the long arm of the chromosome 13 is duplicated. (B) IGV visualization of the breakpoint located on chromosome 13 shows that there is a difference in depth from either side of the breakpoint (represented by the black vertical line). (C) A screen shot from the Loupe visualization. Shown are linear (top left and right panels) and matrix (bottom left and right panels) representations at the breakpoint intervals. The left panels show the coordinates of the two breakpoints from chromosome 9 and 13 as well as the translocation site (pinpointed by the black arrow). The right panel displays a focus on the chromosome 13 breakpoint showing a mild increase in read depth for the distal segment, corresponding to the duplication in chromosome 13 (red arrow)
