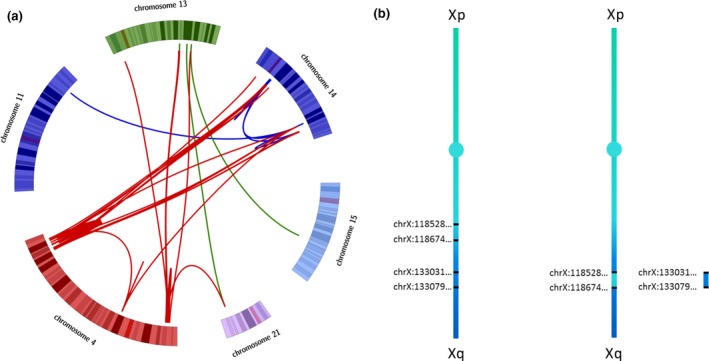
Figure 3.

Patients 4 and 5. (A) Circos plot of the chromothripsis of patient 4. We note that there is a certain clustering of the breakpoints on chromosomes 4 and 14. (B) Chromosome representation of the CNVs from patient 5. The left panel represents the normal chromosome. The breakpoints of the proximal inserted segment and those of the distal deleted segment are indicated. The right panel represents the rearranged chromosome with the 100 kb proximal duplicated segment being inserted between the breakpoints of the 50 kb distal deletion
