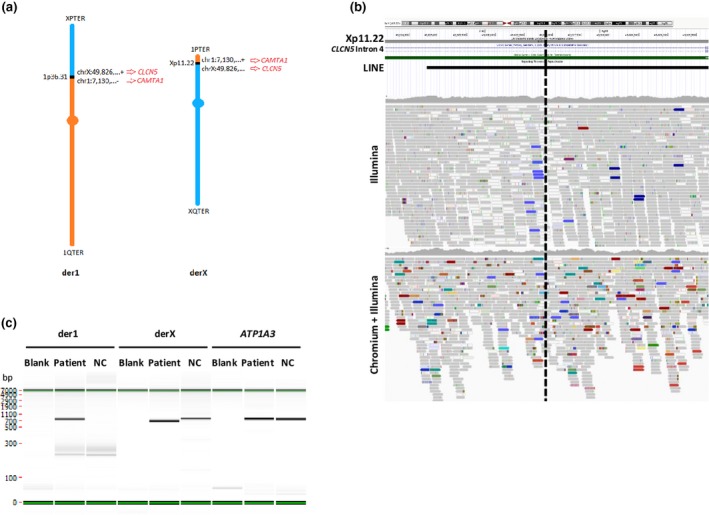
Figure 4.

Patient 7: SV representation and results. (A). The (X;1) reciprocal translocation is represented here, with the coordinates of the two breakpoints. Chromosome 1 is colored in orange and chromosome X in blue. (B) IGV visualization and UCSC genome browser show that the breakpoint on chromosome X (indicated by the black dashed line) disrupts the CLCN5 gene and is located in a LINE sequence. (C) Results of the specific PCR amplification of the two fusion points at both derivative chromosomes (der1 and derX) and a control locus (on the ATP1A3 gene). NC = negative control corresponding to DNA from an individual who does not have the translocation
