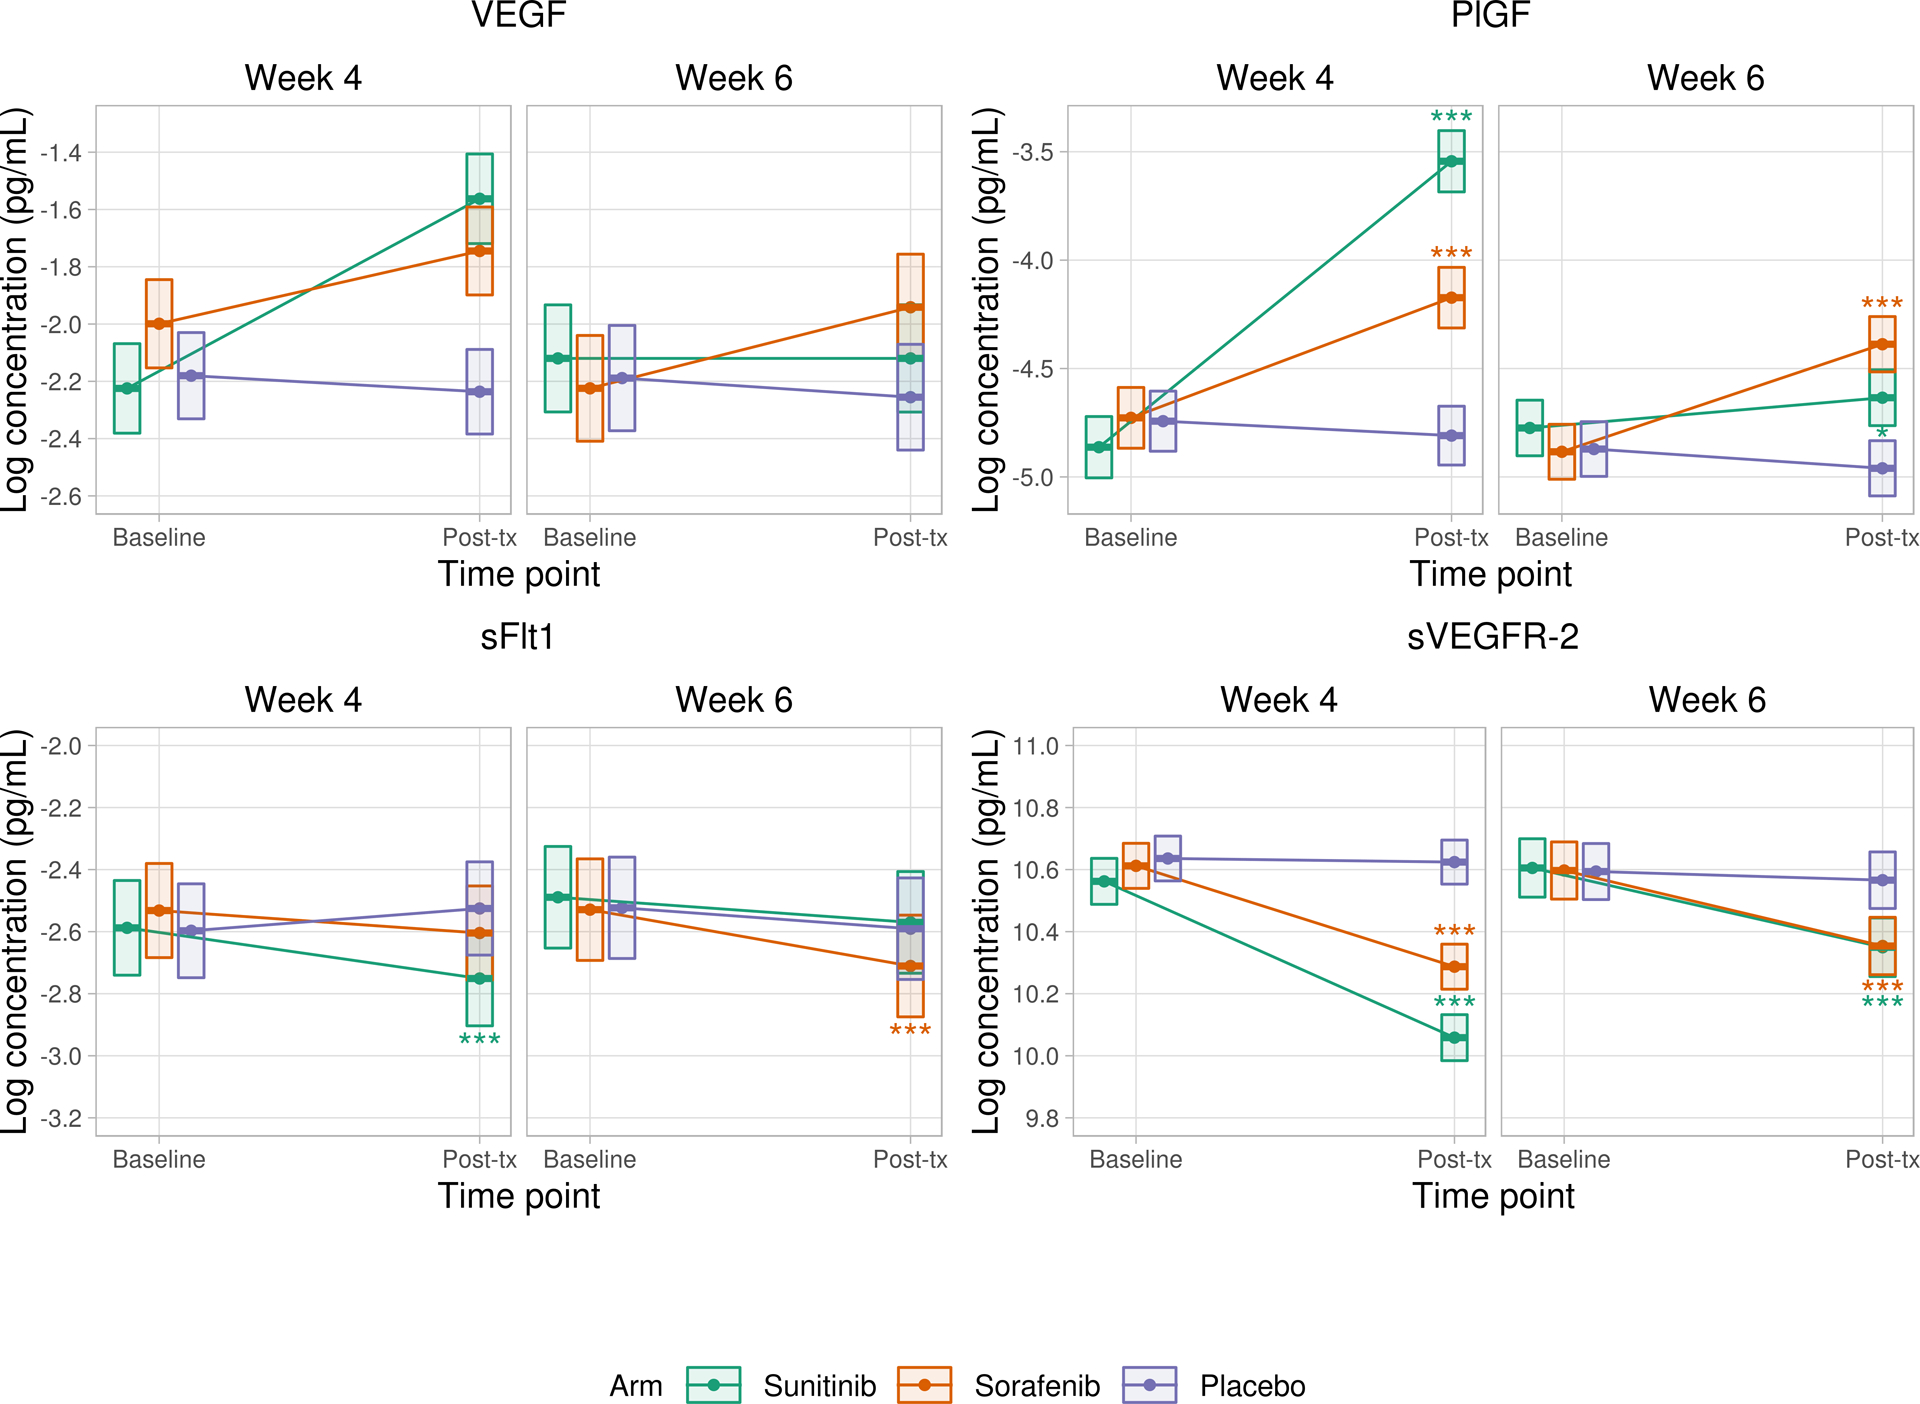
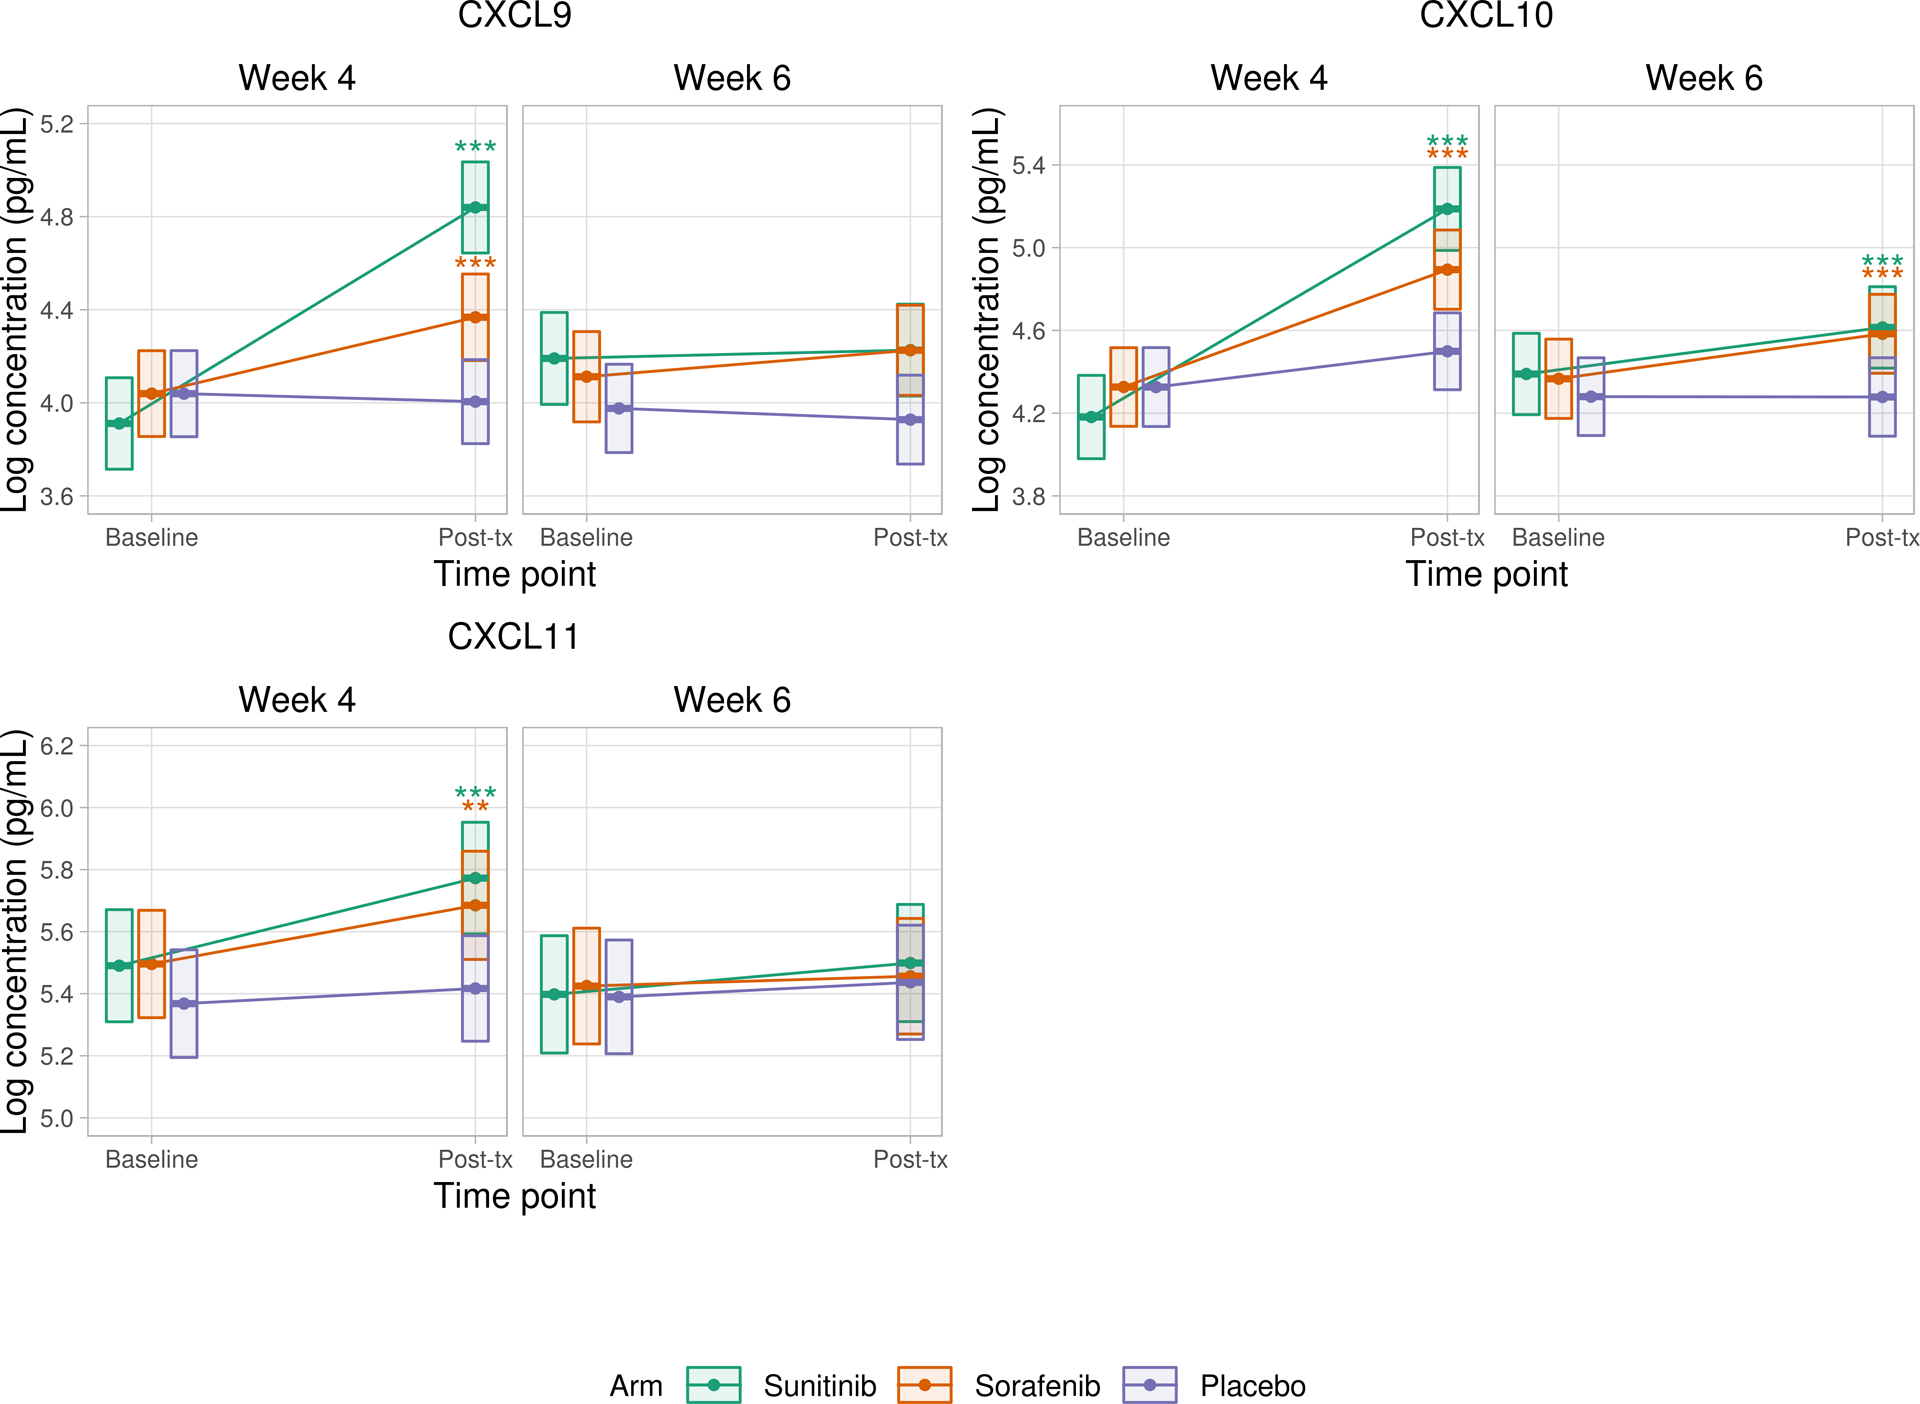
Figure 2:


A) Changes in VEGF, PlGF, sFLT-1, and sVEGFR-2 compared to baseline values
B) Changes in CXCL9, CXCL10, and CXCL11 compared to baseline values
Repeated measures mixed effects models were fit to compare baseline versus follow-up values for each angiogenic factor and cytokine at week 4 and week 6. Correlation within repeated measures for a given patient was accounted for by assuming compound symmetry in the covariance matrix. Random effects for plate and processing day were included. Differences in model fixed effects were used to compare baseline versus follow-up values for each angiogenic factor and cytokine in each of the treatment arms. Each patient had measurement of cytokine levels at baseline and then at either 4 weeks or 6 weeks (but not both), which results in distinct (but statistically indistinguishable) baseline groups when comparing baseline values against week 4 versus week 6.
Boxes represent point estimates and 95% confidence intervals.
* p<0.05 ** p<0.01 *** p<0.001
