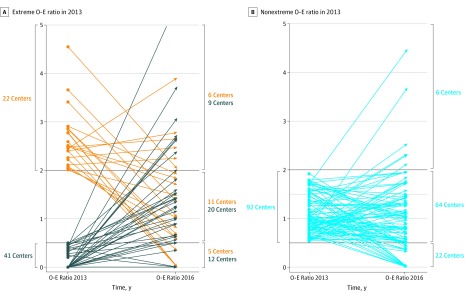
Figure. Changes in Observed-to-Expected (O-E) Ratios in the Year of Measurement and Actual Performance by the Time of Report Publication.
The figure demonstrates changes in O-E ratio between 2013 and 2016 for each center. In panel A, O-E ratio changes for centers with O-E ratio greater than 2 in 2013 are displayed in orange and O-E ratio less than 0.5 in 2013 are displayed in dark blue. In panel B, O-E ratio changes for centers with O-E ratio between 0.5 and 2 in 2013 are displayed. Number of centers in corresponding O-E ratio strata in 2013 (left axis) and 2016 (right axis) are displayed.

