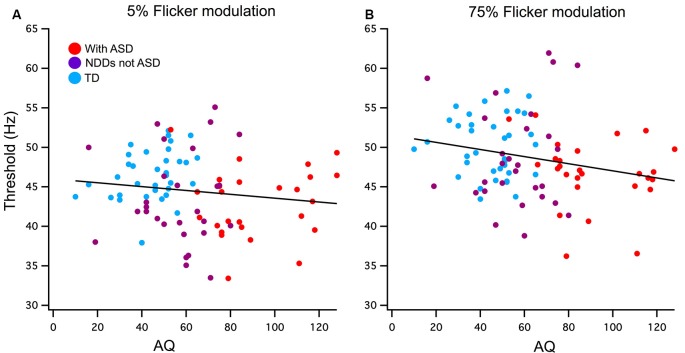
Figure 2.
(A) Low (5%) and (B) high (75%) contrast FFTs correlation with Autism-Spectrum Quotient (AQ) score. Participants have been grouped as typically developing (TD; blue) or neurodevelopmental disorder (NDD) without ASD (purple) and NDD with ASD (red) to highlight the AQ continuation between the groups in this correlation. A significant negative relationship was found between AQ and 75% temporal contrast FFT, however, no significant correlation was found in the 5% temporal contrast condition.

