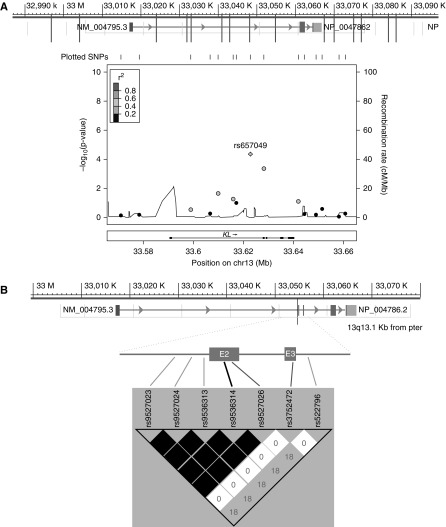
Figure 2.
Association with pressure natriuresis of single nucleotide polymorphisms (SNPs) in KL region. (A) Tag SNPs covering the entire gene with extension to the 5′ and 3′ flanking regions and regional plot for association with pressure natriuresis at time 120 minutes. (B) Linkage disequilibrium (LD) map for the KL SNPs around exons 2–3. Numeric values represent pairwise LD as measured by r2. SNPs in high LD are represented by darker squares (r2>0.80). Chr13, chromosome 13; pter, p terminal; E2/3, exon 2/3.

