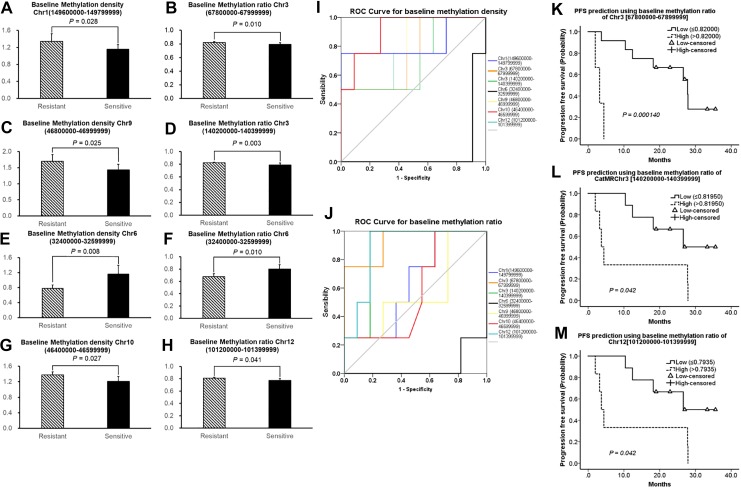
Figure 2.
Comparison of baseline methylation status of 7 selected DMRs between EXEr and EXEs patients. Comparison of baseline MD of certain DMRs between EXEr and EXEs group (A, C, E, G); comparison of baseline MR of certain DMRs between EXEr and EXEs groups (B, D, F, H). Receiver operating characteristic curve analysis for 7 selected DMRs in terms of MD (I) and MR (J). Kaplan-Meier survival analysis for baseline MR of Chr3 [67800000-67999999] (K), Chr3 [140200000-140399999] (L), and Chr12 [101200000-101399999] (M). “Resistant” indicates EXEr patients, “sensitive” indicates EXEs patients. Chr indicates chromosome; DMRs, differential methylation regions; EXEr, exemestane resistance; EXEs, exemestane sensitive; MD, methylation density; MR, methylation ratio.

