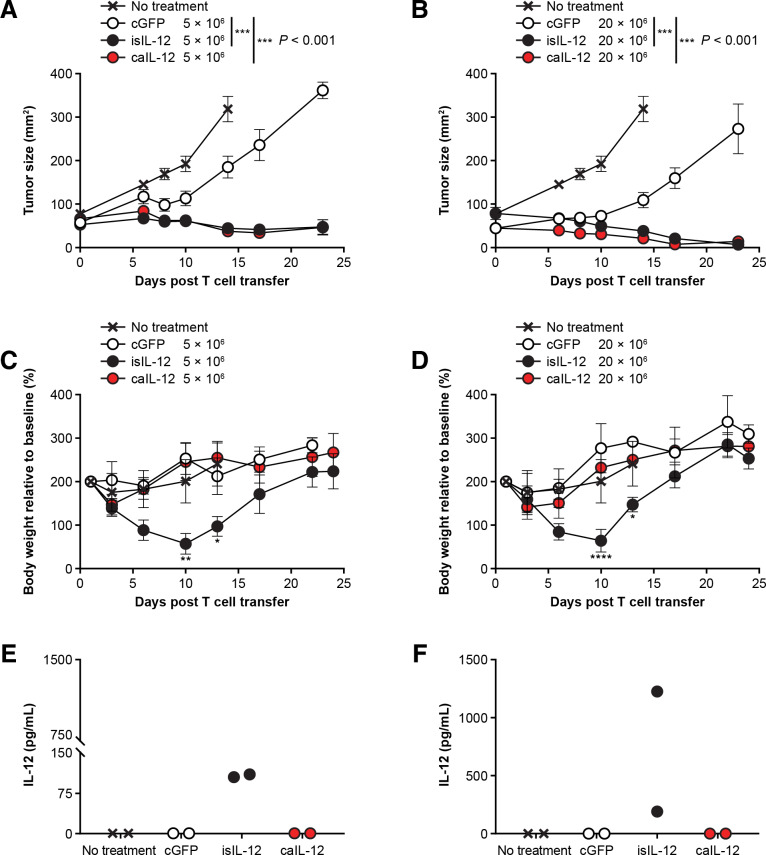
Figure 2.
Pmel-1 T cells expressing caIL-12 displayed enhanced tumor regression without evidence of toxicity. (A, B) Pmel-1 T cells were transduced with the vectors indicated. Either (A) 5×10⁶ or (B) 20×106 cells were administered by tail-vein injection to B16 tumor-bearing mice. All mice received 550 cGy of whole-body radiation before treatment. isIL-12 served as a positive control for systemic IL-12 exposure. Serial tumor measurements were obtained. N=5 mice per group. Error bars reflect the standard error of the mean. P values represent comparison between caIL-12 or isIL-12 and cGFP using a matched-pairs, repeated-measures two-way ANOVA test. (C, D) The change in body weight relative to baseline is shown. Error bars show the standard error of the mean. P values represent comparison between caIL-12 and isIL-12 at each time point using a two-way ANOVA multiple comparisons test. *P<0.05, **P<0.01, ****P<0.0001. (E, F) Serum IL-12 levels were determined for mice in panels A and B on day 3 after treatment. Values for individual mice are shown.; ANOVA, analysis of variance; caIL-12, constitutive anchored interleukin-12; cGFP, constitutively expressed green fluorescent protein; isIL-12, inducible secreted interleukin-12.

