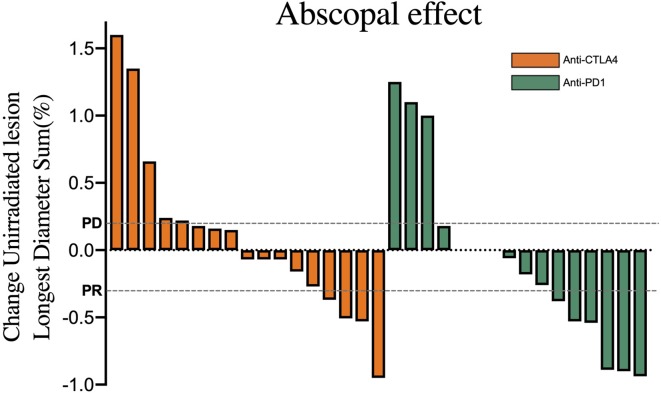
Figure 2.
Waterfall and distribution plots of out-of-field responses. Values were derived from changes in the sum of the longest diameter of the out-of-field lesions, assessed according to response evaluation criteria in solid tumors guidelines: overall response rate (ie, PR/complete response) and disease control rate (ie, any response other than PD). CTLA4, cytotoxic T-lymphocyte-associated protein 4; PD, progressive disease; PD1, programmed death-1; PR, partial response; SD, stable disease.

