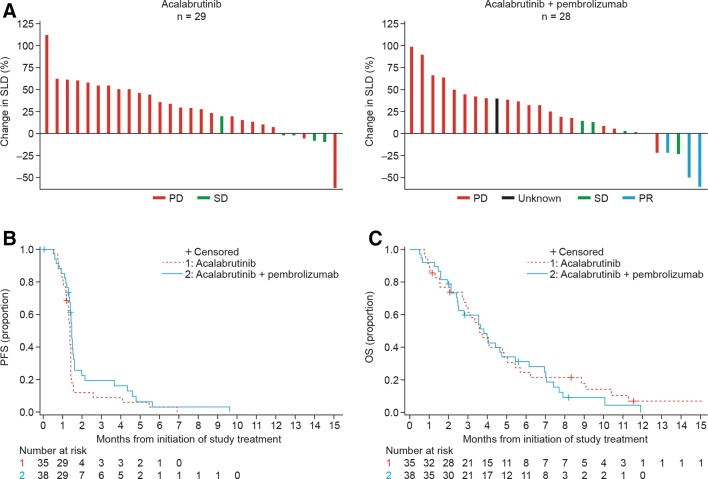
Figure 1.
Efficacy outcomes stratified by treatment arm (monotherapy and combination therapy). (A) Best radiographic response according to RECIST V.1.1: data show maximum change from baseline in SLD. (B) Kaplan-Meier plot for PFS based on objective tumor assessment by the investigator per RECIST V.1.1, based on the safety analysis set. (C) Kaplan-Meier plot for OS based on the safety analysis set. OS, overall survival; PD, progressive disease; PFS, progression-free survival; PR, partial response; RECIST V.1.1, Response Evaluation Criteria in Solid Tumors version 1.1; SD, stable disease; SLD, sum of longest diameters.

