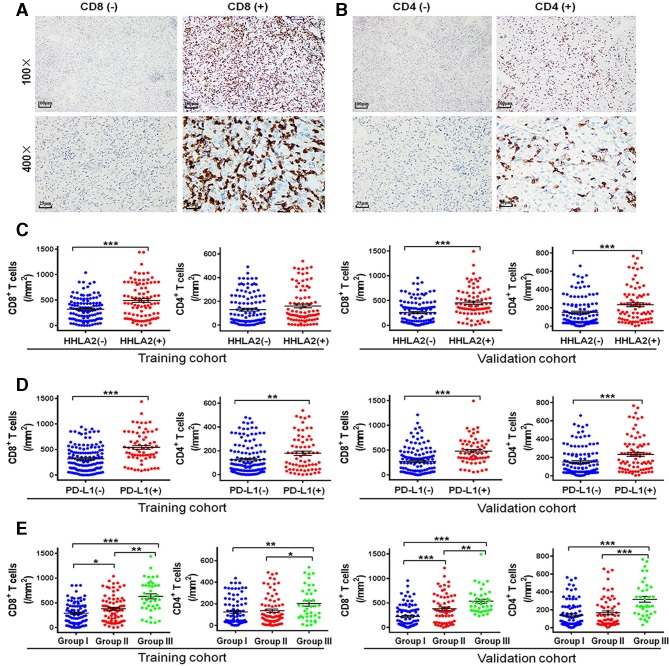
Figure 3.
Representative micrographs of CD8 (A) and CD4 (B) expression and the corresponding negative controls within the tumor. Scatter plot depicted the correlation between HHLA2 and PD-L1 expression and classic subsets of T cells. (C) The correlation of HHLA2 expression and CD8+ T cells and CD4+ T cells in the training cohort and validation cohort. (D) The correlation of PD-L1 expression and CD8+ T cells and CD4+ T cells in the training cohort and validation cohort. (E) The correlation of the HHLA2/PD-L1 co-expression and CD8+ T cells and CD4+ T cells in the training cohort and validation cohort. Group I: HHLA2 (−)/PD-L1 (−); group II: HHLA2 (+)/PD-L1 (−) or HHLA2 (−)/PD-L1 (+); group III: HHLA2 (+)/PD-L1 (+). HHLA2, human endogenous retrovirus-H long terminalrepeat-associating protein 2; PD-L1, programmed death 1 ligand 1.

