Figure 7.
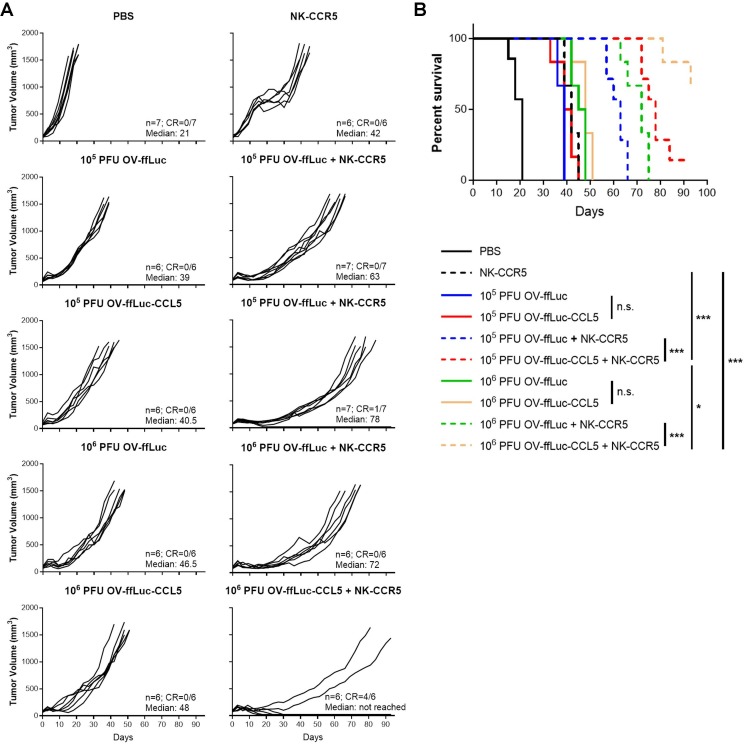
CCL5-expressing vaccinia virus augmented NK-CCR5 cell therapy. As depicted in figure 6, mice inoculated with HCT-116 cells received the indicated treatments. (A, B) Tumor growth (A) and mouse survival (B) were monitored separately. The number and median survival time (days) of mice from different groups are indicated in corresponding plots. Kaplan-Meier curves and log-rank tests were used to estimate and compare survival, respectively, followed by Bonferroni correction. *P<0.05, **P<0.01, ***P<0.005. n.s. indicates no significant difference; NK, natural killer; OV, oncolytic viruse; PFU, plaque-forming unit.

