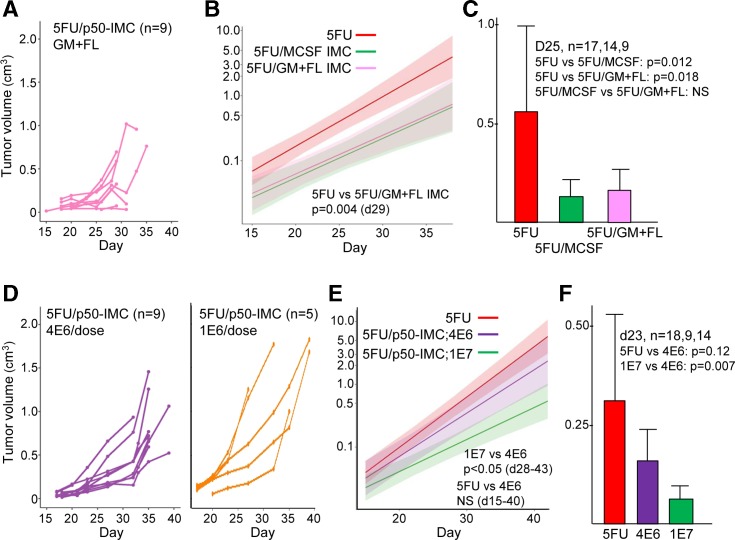
Figure 4.
Efficacy of p50-IMC generated using FL and low-dose GM-CSF and p50-IMC dose–response. (A) Individual tumor volumes as measured every 2–4 days are shown for treatment with 5FU alone, 5FU/p50-IMC (M-CSF) or 5FU/p50-IMC (GM+FL). data are combined from two experiments. (B) These data were fit to an exponential model, with semilog plots and comparison of expected mean tumor volumes between the 5FU and 5FU/p50-IMC (GM+FL) groups on day 29. (C) Mean tumor volumes and SEs as measured on day 25 (or day 26) are shown. (D) Prostate cancer tumor growth data in response to 5FU followed by three doses of 4×10⁶ or 1×10⁶ p50-IMC are shown, with data combined from two experiments. (E) These data and data from figure 3 for 5FU alone were fit to an exponential model, with semilog plots and comparison of expected mean tumor volumes between the 5FU and 5FU/p50-IMC (4E6) groups shown for days 15–40. (F) Tumor volumes as measured on day 23 (or day 22) for these two groups are also compared. 5FU, 5-fluorouracil; FL, Flt3 ligand; GM, granulocyte–monocyte; GM-CSF, granulocyte–monocyte colony-stimulating factor; IMC, immature myeloid cell; M-CSF, monocyte colony-stimulating factor; NS, not significant; p50-IMC, p50-negative immature myeloid cell.

