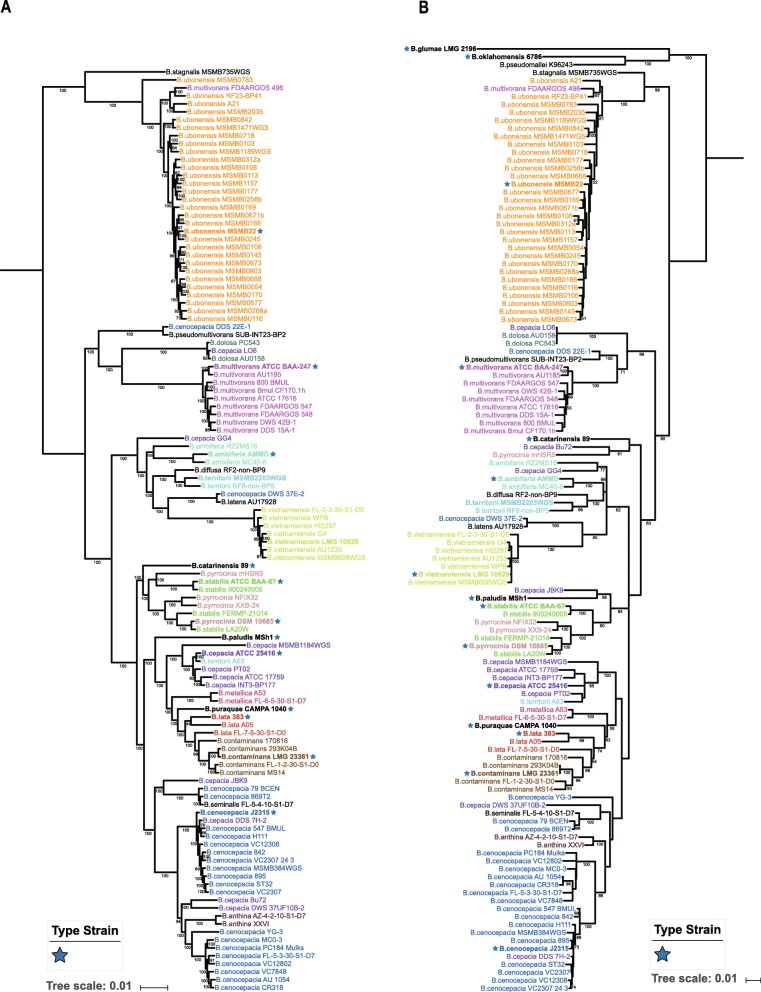
Fig. 2.
Comparison of MLSA and species tree. a Maximum-likelihood phylogenetic tree of 116 BCC genomes based on concatenated amino acid alignments of 1005 single-copy orthologous genes (274,980 AA) and rooted at node pointed out by MLSA phylogeny. Node support values were based on the Shimodaira-Hasegawa test. b Maximum-likelihood phylogenetic tree of the concatenated nucleotide sequences (2771 bp) from the seven housekeeping gene fragments [atpD (443 bp), gltB (400 bp), gyrB (454 bp), recA (393 bp), lepA (395 bp), phaC (385 bp) and trpB (301 bp)]. B. pseudomallei K96243, B. oklahomensis C6786T and B. glumae LMG 2196T were chosen as outgroups. Other display settings in (a) and (b) are the same as in Fig. 1

