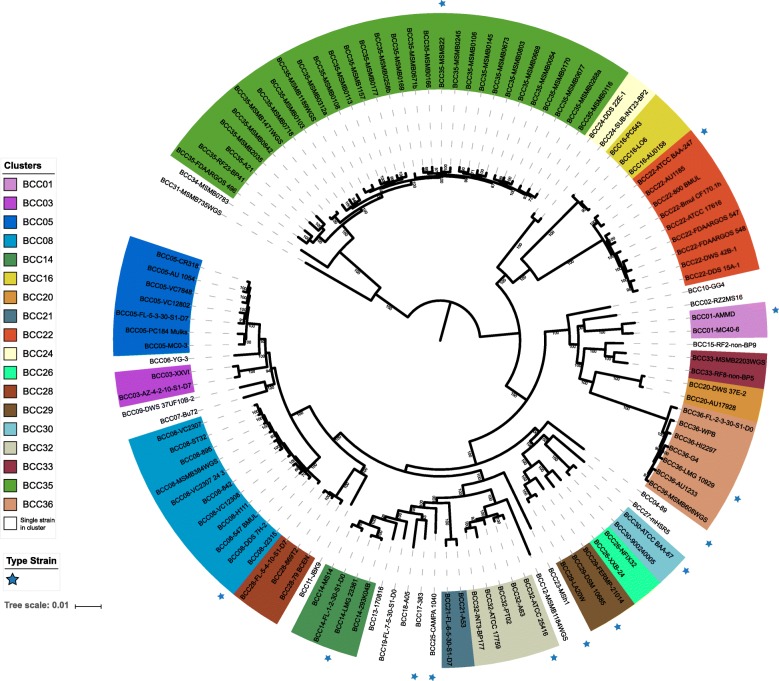
Fig. 5.
Reclassification of 116 BCC genomes.The maximum-likelihood phylogenetic tree is the same tree as in Fig. 2a except the layout is a circle instead of a rectangular phylogram. Leaves are colored according to their affiliation with clusters. (i.e., Burkholderia cepacia complex, BCC) and with at least two members; clusters with single members have a white background. Type strains are printed in bold font as well as marked by a blue star. Node support values from the Shimodaira-Hasegawa test are not shown if below 50%. The backgrounds are colored according to the corresponding cluster

