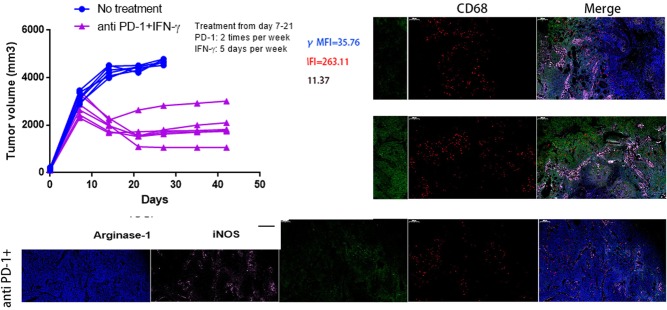
Figure 5.
PD1 checkpoint blockade is more effective in tumor-bearing mice when combinatorial using IFN-γ. (A) RT-PCR was performed to assess the expression of CXCL8 mRNA in murine BxPC-3 tumors when IFN-γ (1×10⁴ U per mouse, 5 days per week) treated for 7, 14, 21 days (left panel); immunoblotting assay for detection of CXCL8 protein expression after IFN-γ treatment (middle panel); CXCL8 in serum samples collected from BxPC-3 tumor-bearing mice with IFN-γ treatment were measured by ELISA (right panel). (B) BxPC-3 tumor volumes were monitored when anti-PD1 (200 mg per mouse, two times per week) (left panel), IFN-γ (1×10⁴ U per mouse, 5 days per week) (middle panel) or anti-PD1+IFN-γ (right panel) treatment starting on day 7 after tumor inoculation (n=6 per group). The endpoint for tumor growth analysis is day 42 after tumor inoculation. (C) Kaplan-Meier survival curves showed the overall survival of no treatment, anti-PD1, IFN-γ or anti-PD1+IFN-γ treatment groups and evaluated using log-rank statistics (n=6 per group). The endpoint for mice survival analysis is day 42 after tumor inoculation. (D) The percentages of CXCR2+CD68+ macrophages in BxPC-3 tumor-bearing mice peripheral blood from four experimental groups as in (C) were measured by flow cytometry (day 14). NS, not significant. (E) Tumor tissue immunofluorescence tri-markers staining images of CXCL8 and tumor-infiltrating CXCR2+CD68+ macrophages from BxPC-3 tumor xenografts after anti-PD1, anti-PD1+IFN-γ treatment or no treatment (day 21) (left panel). Scale bars represent 200 µm. IOD sums of CXCL8 (right top panel) and the percentages of tumor-infiltrating CXCR2+CD68+ macrophages (right bottom panel) from three groups were calculated using Image-Pro Plus V.6.0 software (day 21). IOD, index of distribution. (F) RT-PCR was performed to evaluate levels of arginase-1 and iNOS produced by sorted tumor-infiltrating CXCR2+CD68+ macrophages from cohorts of mice as in (E) on day 21. NS, not significant. (G) FACS histograms showing surface expression of PD-L1 on gated populations of circulating CXCR2+CD68+ macrophages from cohorts of mice as in (E) on day 21. (H) RT-PCR was performed to detect the mRNA expression of PD-L1 in sorted tumor-infiltrating CXCR2+CD68+ macrophages from cohorts of mice as in (E) on day 21. MFI, mean fluorescent intensity. Two-tailed unpaired t-test or Kaplan-Meier survival analysis with log-rank test was used to calculate p values.

