Figure 2.
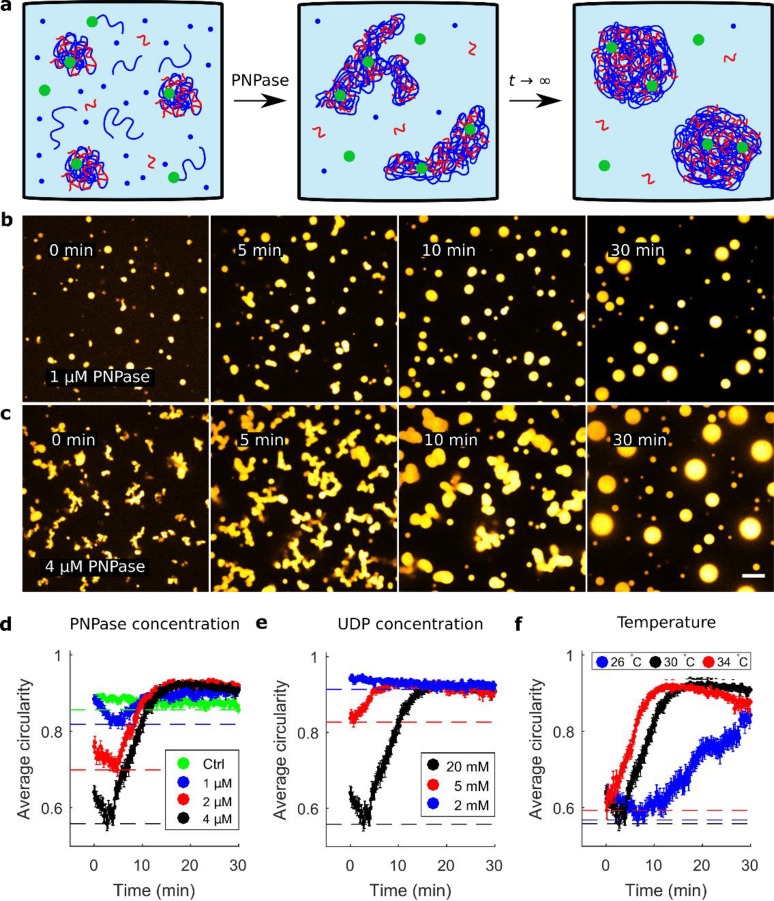
Quantification of nonequilibrium coacervate shapes by average circularity of cross sections. (a) Schematic depiction of PNPase reaction in the presence of poly(U)/spermine coacervates in equilibrium, supplemented with poly(U) seeds, UDP, and PNPase. Initially, the coacervates become active but as the reaction reaches a dynamic equilibrium (t → ∞), they assume their spherical equilibrium shape. (b,c) PNPase reaction in the presence of preformed coacervates with 1 μM (b) and 4 μM (c) PNPase. There is a significant qualitative difference in terms of the coacervate shapes prior to assuming a spherical equilibrium shape. Images are false-colored and the scale bar indicates 10 μm. (d) Plot of the average circularity of coacervate cross sections for PNPase concentrations of 4 μM (black), 2 μM (red), and 1 μM (blue) PNPase. The control (green) contained passive poly(U)∞/spermine coacervates, which were produced by incubation of PNPase, poly(U)20, and UDP (see Materials and Methods for details). Dashed lines indicate the minimum observed average circularity per condition. In all images, PNPase was added 5 min before the start of image acquisition. (e) Average circularity profiles for 20 mM (black), 5 mM (red), and 2 mM (blue) UDP. (f) Average circularity profiles for temperatures of 30 °C (black), 34 °C (red), and 26 °C (blue). In panels d–f, the error bars indicate standard error from the mean.

