Figure 4.

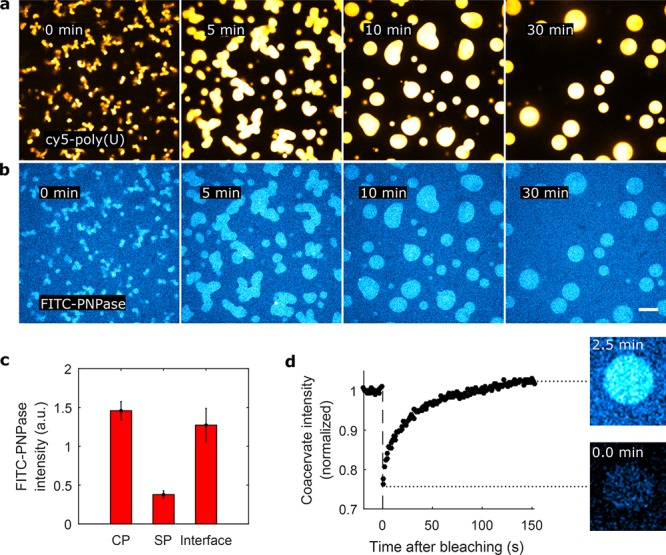
Localization of reaction components in active poly(U)/spermine coacervates. (a,b) PNPase reaction with 5′-end Cy5-labeled poly(U) (panel a) and FITC-labeled PNPase (panel b). To illustrate the difference, images were false-colored with Cy5-poly(U) in yellow and FITC-PNPase in blue. Scale bar indicates 10 μm. (c) Fluorescence intensities of FITC-PNPase in the coacervate phase (CP), solvent phase (SP), and at the CP–SP interface. This implies that the PNPase concentration inside the coacervate phase is 3.9-fold higher than in the surrounding solvent phase (see Materials and Methods). Error bars indicate the standard deviation. (d) Fluorescence recovery after photobleaching (FRAP) of FITC-PNPase fluorescence indicates recovery of FITC-PNPase within 2.5 min. This indicates that there is continuous exchange of PNPase with the surrounding solvent phase and that the PNPase is redistributed throughout the coacervate phase.
