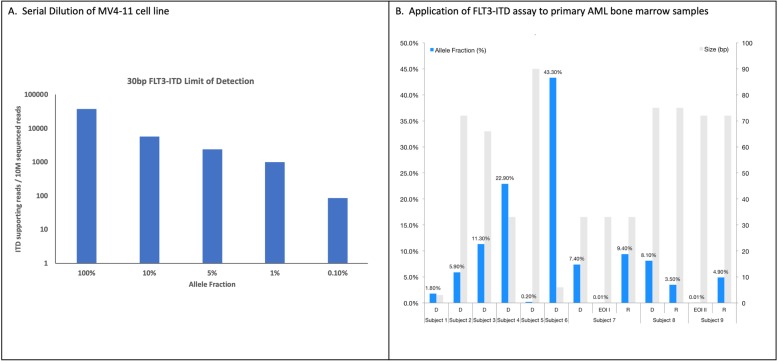
Fig. 3.
Development of a specific and sensitive NGS panel for FLT3-ITD detection and disease monitoring. a Serial dilution results for MV4–11 cell line (30 bp ITD in FLT3). The x-axis is allele fraction and y-axis is the number of ITD supporting reads / 10 M sequencing reads. b Nine leukemia samples were analyzed with varying ITD sizes (right y-axis, grey bars) and allele fraction (left y-axis, blue bars). Subjects are across the x-axis, with D = diagnosis, EOI = end of induction, and R = relapse sample

