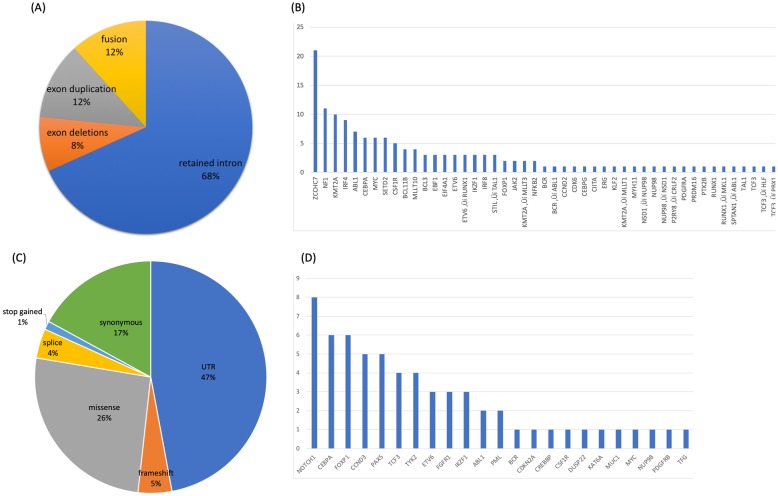
Fig. 4.
Summary of RNA-ECS results for pediatric leukemia diagnostic samples. a Distribution of allelic specific single nucleotide variants and gene counts. Pie chart represents the distribution across all leukemia samples. b The bar graph represents the counts per gene. c Distribution of RNA StVs and gene counts. Pie chart represents the distribution across all leukemia samples for SNVs. d The bar graph represents the counts per gene

